Philadelphia Race
and Segregation
W.E.B. DuBois: Mapping Workshop in Exploration of
Racial and Cultural Boundaries in Philadelphia
These data visualizations were created by a team of nine students led by multi-modal designer Silas Munro during the UArts Graphic Design program’s one-week intensive Exposed Workshops in March 2019. Inspired by the groundbreaking graphics created for the 1900 Paris World Fair by African-American historian and sociologist W.E.B. Du Bois illustrating both literal and figurative representations of “the color line” in America, the UArts students researched and mapped the many ways segregation manifests itself in Philadelphia during today’s racially divisive times. As Munro states in W.E.B. Du Bois’s Data Portraits: Visualizing Black America (Princeton Architectural Press, October 2018), “infographic activism” remains a powerful tool for getting to the heart of inequities, as useful now as it was over a hundred years ago. The complete student project brief can be downloaded here.
The Peculiar Condition of Being Black
Demographic Characteristics
Change in Household Income
Philadelphia Corridor Segregation
History of Gayborhood
Police-Involved Shootings
Hate Crimes & Extremism
Double Consciousness in Art Students
District Analysis of Crime and Race
The Peculiar Condition of Being Black
By Kibria Chavez
“On the contrary, the great force of history comes from the fact that we carry it within us, are unconsciously controlled by it in many ways, and history is literally present in all that we do. It could scarcely be otherwise, since it is to history that we owe our frames of reference, our identities, and our aspirations.” —James Baldwin, 1965
How has the systematic oppression of African-Americans affected black culture and the human psyche?
Millions of diverse people make up American society, yet black residents do not experience the same quality comforts as others within this society because of displacement. According to psychology, the forced departure from one’s home, culture, and trusted society becomes a traumatic voyage of isolation that devours the ability to ever feel completely safe.
Regardless of the power to adapt to and overcome slavery, segregation, and current demands of coexistence, the black family has endured several emotionally distressing eras. Excessive abuse and arbitrary behaviors can negatively affect one’s conscious and subconscious mind, create unhealthy power dynamics, and promote a broken communal structure. There is a particular aggression against black lives. Problems that exist in black neighborhoods are further hurt by desensitization to crime, poverty, and gentrification. These problems are painted by the media as nothing more than a “black on black crime,” which only digs a deeper hole for black Americans to pull themselves out of. Gregory Smithsimon, Professor of Sociology at Brooklyn College, argues: “The danger black people find in white neighborhoods comes from neighbors and the government in the form of police who harass, schools that label children as problems, and public services that seem to diminish as the proportion of white residence declines.” These continued acts of aggression perpetuate the ongoing anxiety of living in white society.
Smithsimon’s arguments on racial hazards echo back to W.E.B Du Bois’s phenomena of double consciousness. He describes it as “the experience of always seeing oneself through the eyes of another. A psychic alienation and social isolation produced by the peculiar condition of being black in America.”
We can heal from past and present double consciousness if we utilize visionary tools and data to map a new future.
“James Baldwin on History | Perspectives on History | AHA - American ....” 3 Aug. 2016, https://www.historians.org/publications-and-directories/perspectives-on-history/summer-2016/james-baldwin-on-history.Accessed 23 Mar. 2019.
“Are African American families more vulnerable in a ... - The Guardian.” 21 Feb. 2018, https://www.theguardian.com/books/2018/feb/21/racial-segregation-in-america-causes. Accessed 23 Mar. 2019.
“W.E.B. Du Bois Visualizing Black America” Page 15. 23 Oct. 2018,. Accessed 23 Mar. 2019.
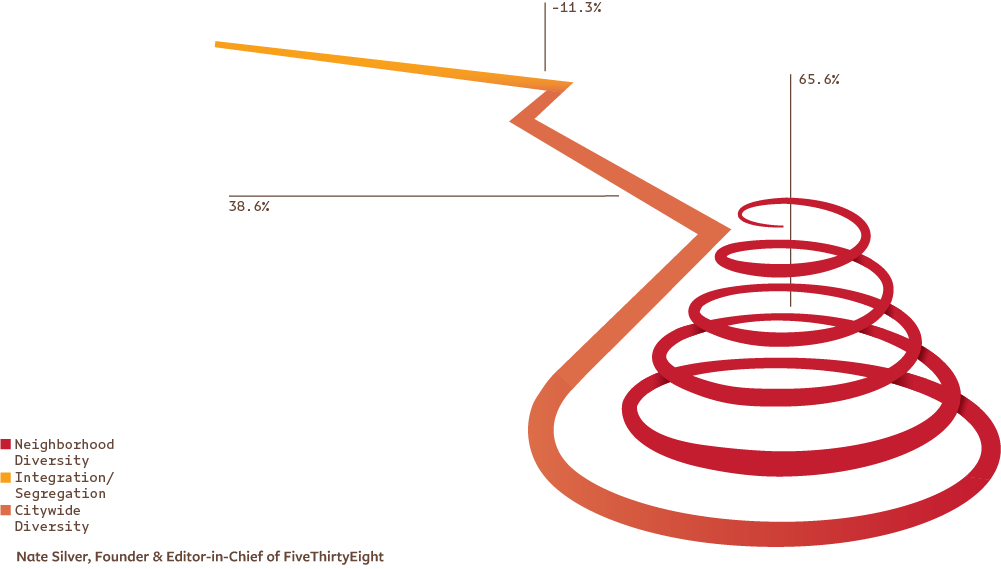
Demographic Characteristics in Philadelphia
by Wendell Hemingway
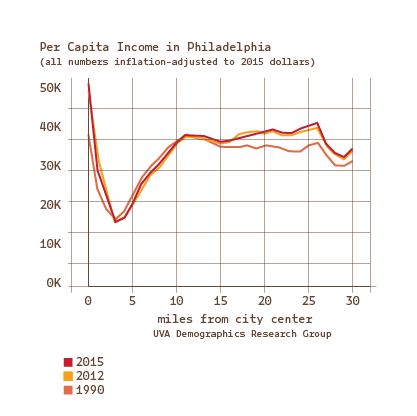
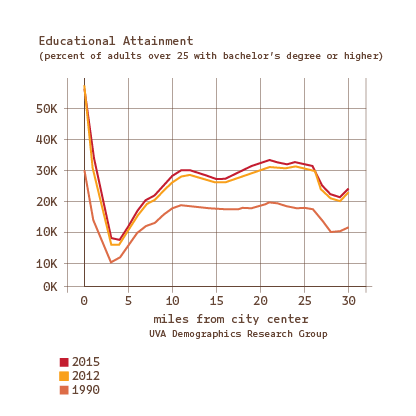
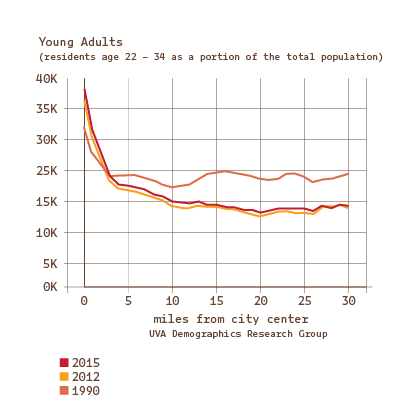
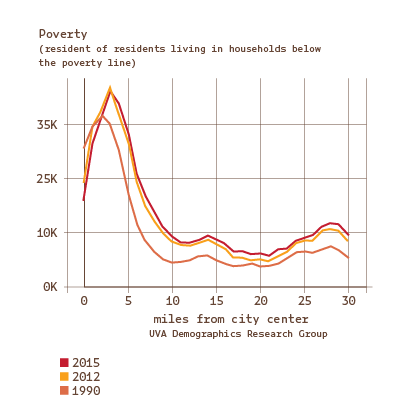
University of Virginia Demographics Research Group: The Changing Shape of American Cities. Weldon Cooper Center for Public Service at the University of Virginia, Philadelphia, PA statistics, 2019, http://statchatva.org/changing-shape-of-american-cities/.
Change In Household Income, 1960 – 2018
by John Teesdale

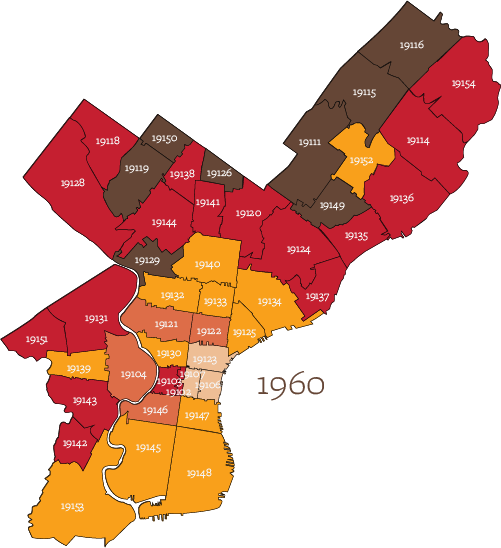
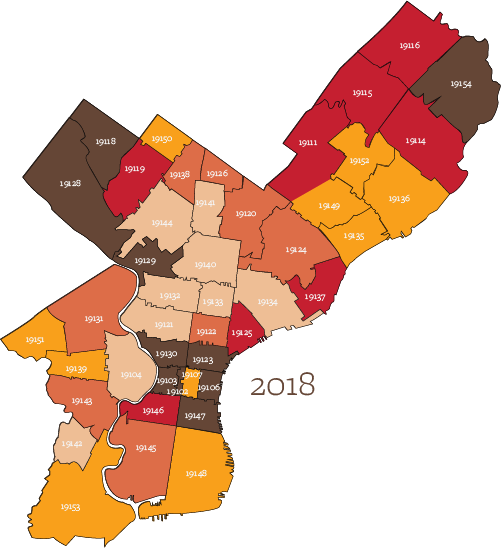
United States Census Bureau 1960 & 2018
| Zip Code | Household Income 1960 (adjusted for inflation) | Household Income 2018 |
|---|---|---|
| 19116 | $63,961 | $51,267 |
| 19154 | $58,319 | $61,892 |
| 19115 | $66,150 | $50,810 |
| 19114 | $56,843 | $56,785 |
| 19111 | $63,370 | $50,159 |
| 19152 | $68,444 | $46,214 |
| 19136 | $53,986 | $45,570 |
| 19149 | $60,809 | $41,599 |
| 19135 | $54,276 | $43,192 |
| 19137 | $51,597 | $52,376 |
| 19124 | $54,332 | $31,219 |
| 19120 | $54,669 | $33,117 |
| 19126 | $65,676 | $37,819 |
| 19141 | $55,606 | $28,398 |
| 19138 | $58,487 | $37,842 |
| 19150 | $66,115 | $44,764 |
| 19118 | $58,564 | $82,712 |
| 19119 | $77,567 | $56,018 |
| 19128 | $55,020 | $67,530 |
| 19144 | $57,934 | $29,505 |
| 19129 | $74,015 | $50,162 |
| 19140 | $44,478 | $18,557 |
| 19134 | $48,945 | $27,546 |
| 19125 | $47,476 | $56,508 |
| 19133 | $41,815 | $15,232 |
| 19132 | $44,295 | $18,918 |
| 19121 | $32,318 | $17,482 |
| 19122 | $33,269 | $32,284 |
| 19130 | $44,754 | $76,464 |
| 19123 | $26,805 | $60,400 |
| 19103 | $56,490 | $70,638 |
| 19102 | $56,490 | $99,167 |
| 19107 | $27,068 | $49,776 |
| 19106 | $24,930 | $106,823 |
| 19146 | $37,813 | $58,784 |
| 19147 | $40,343 | $73,231 |
| 19145 | $49,075 | $39,374 |
| 19148 | $44,140 | $49,469 |
| 19131 | $57,892 | $32,873 |
| 19104 | $33,411 | $25,005 |
| 19151 | $56,693 | $47,287 |
| 19139 | $43,002 | $26,804 |
| 19143 | $50,686 | $32,741 |
| 19142 | $54,386 | $29,581 |
| 19153 | $42,321 | $41,063 |
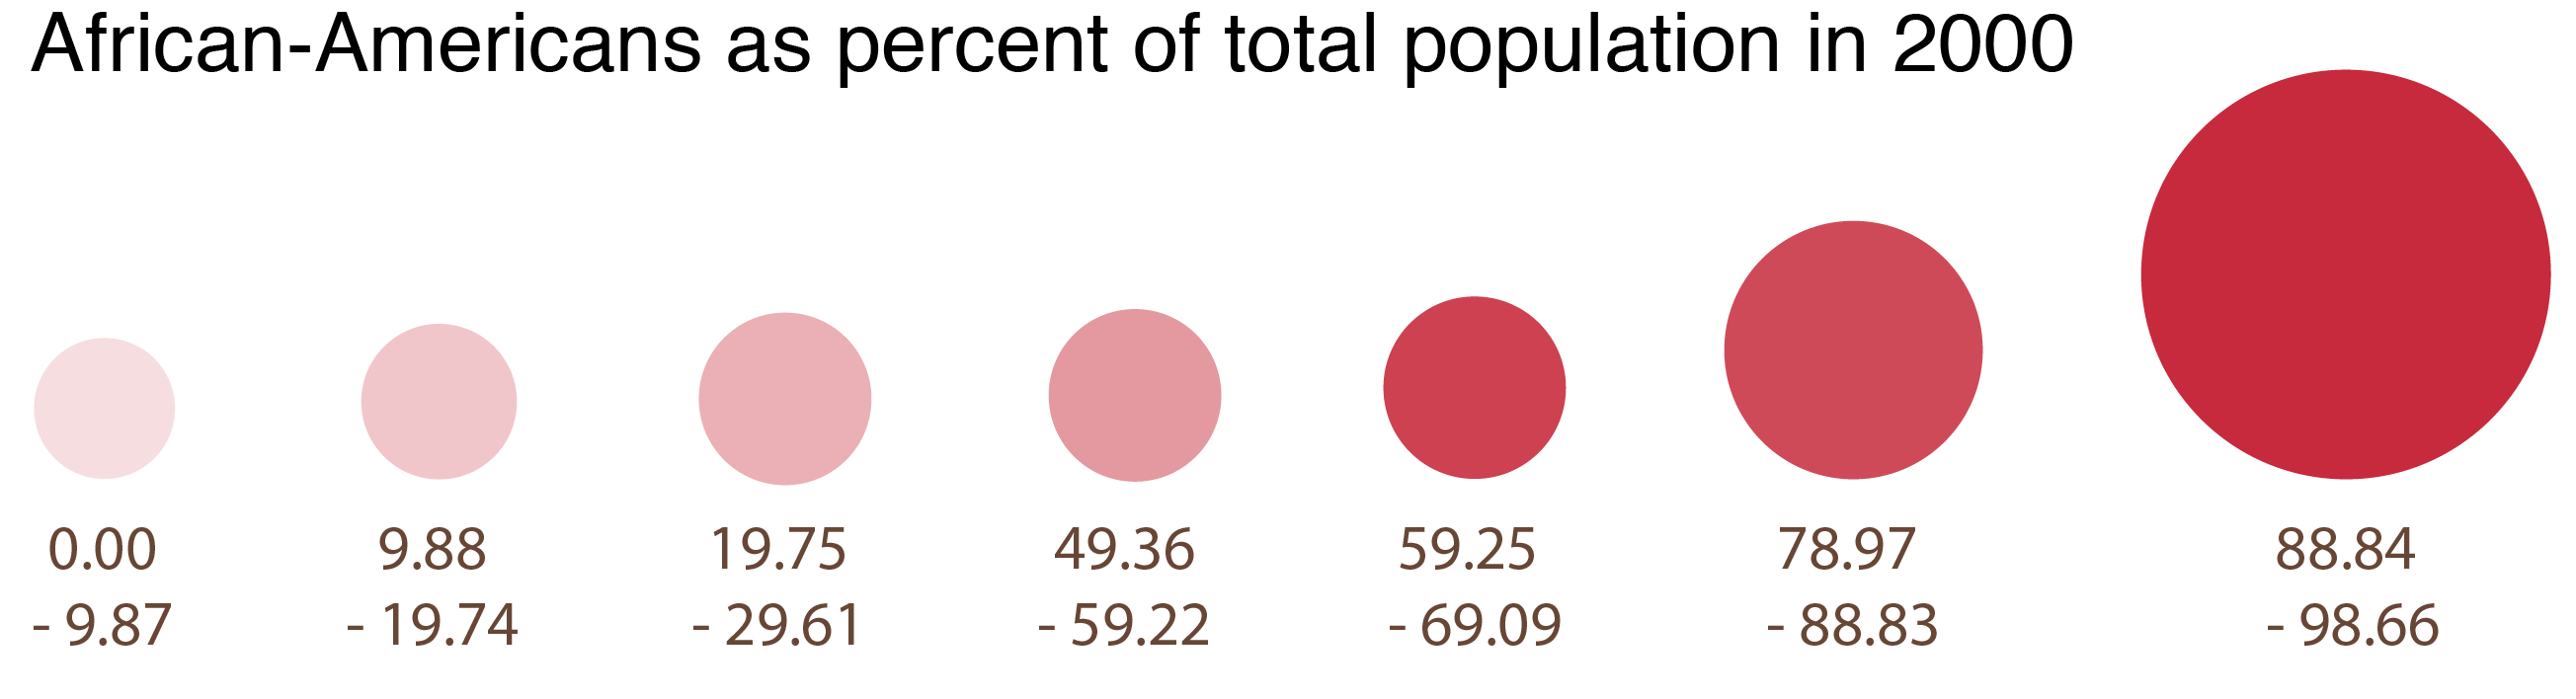
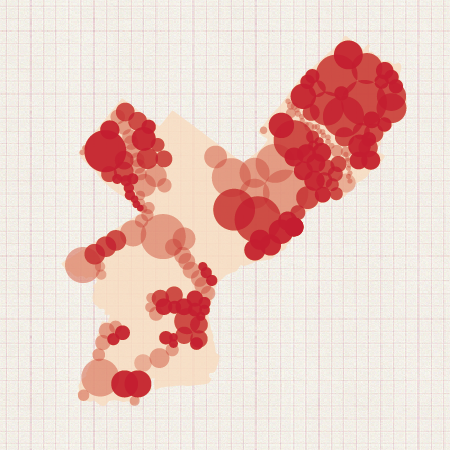
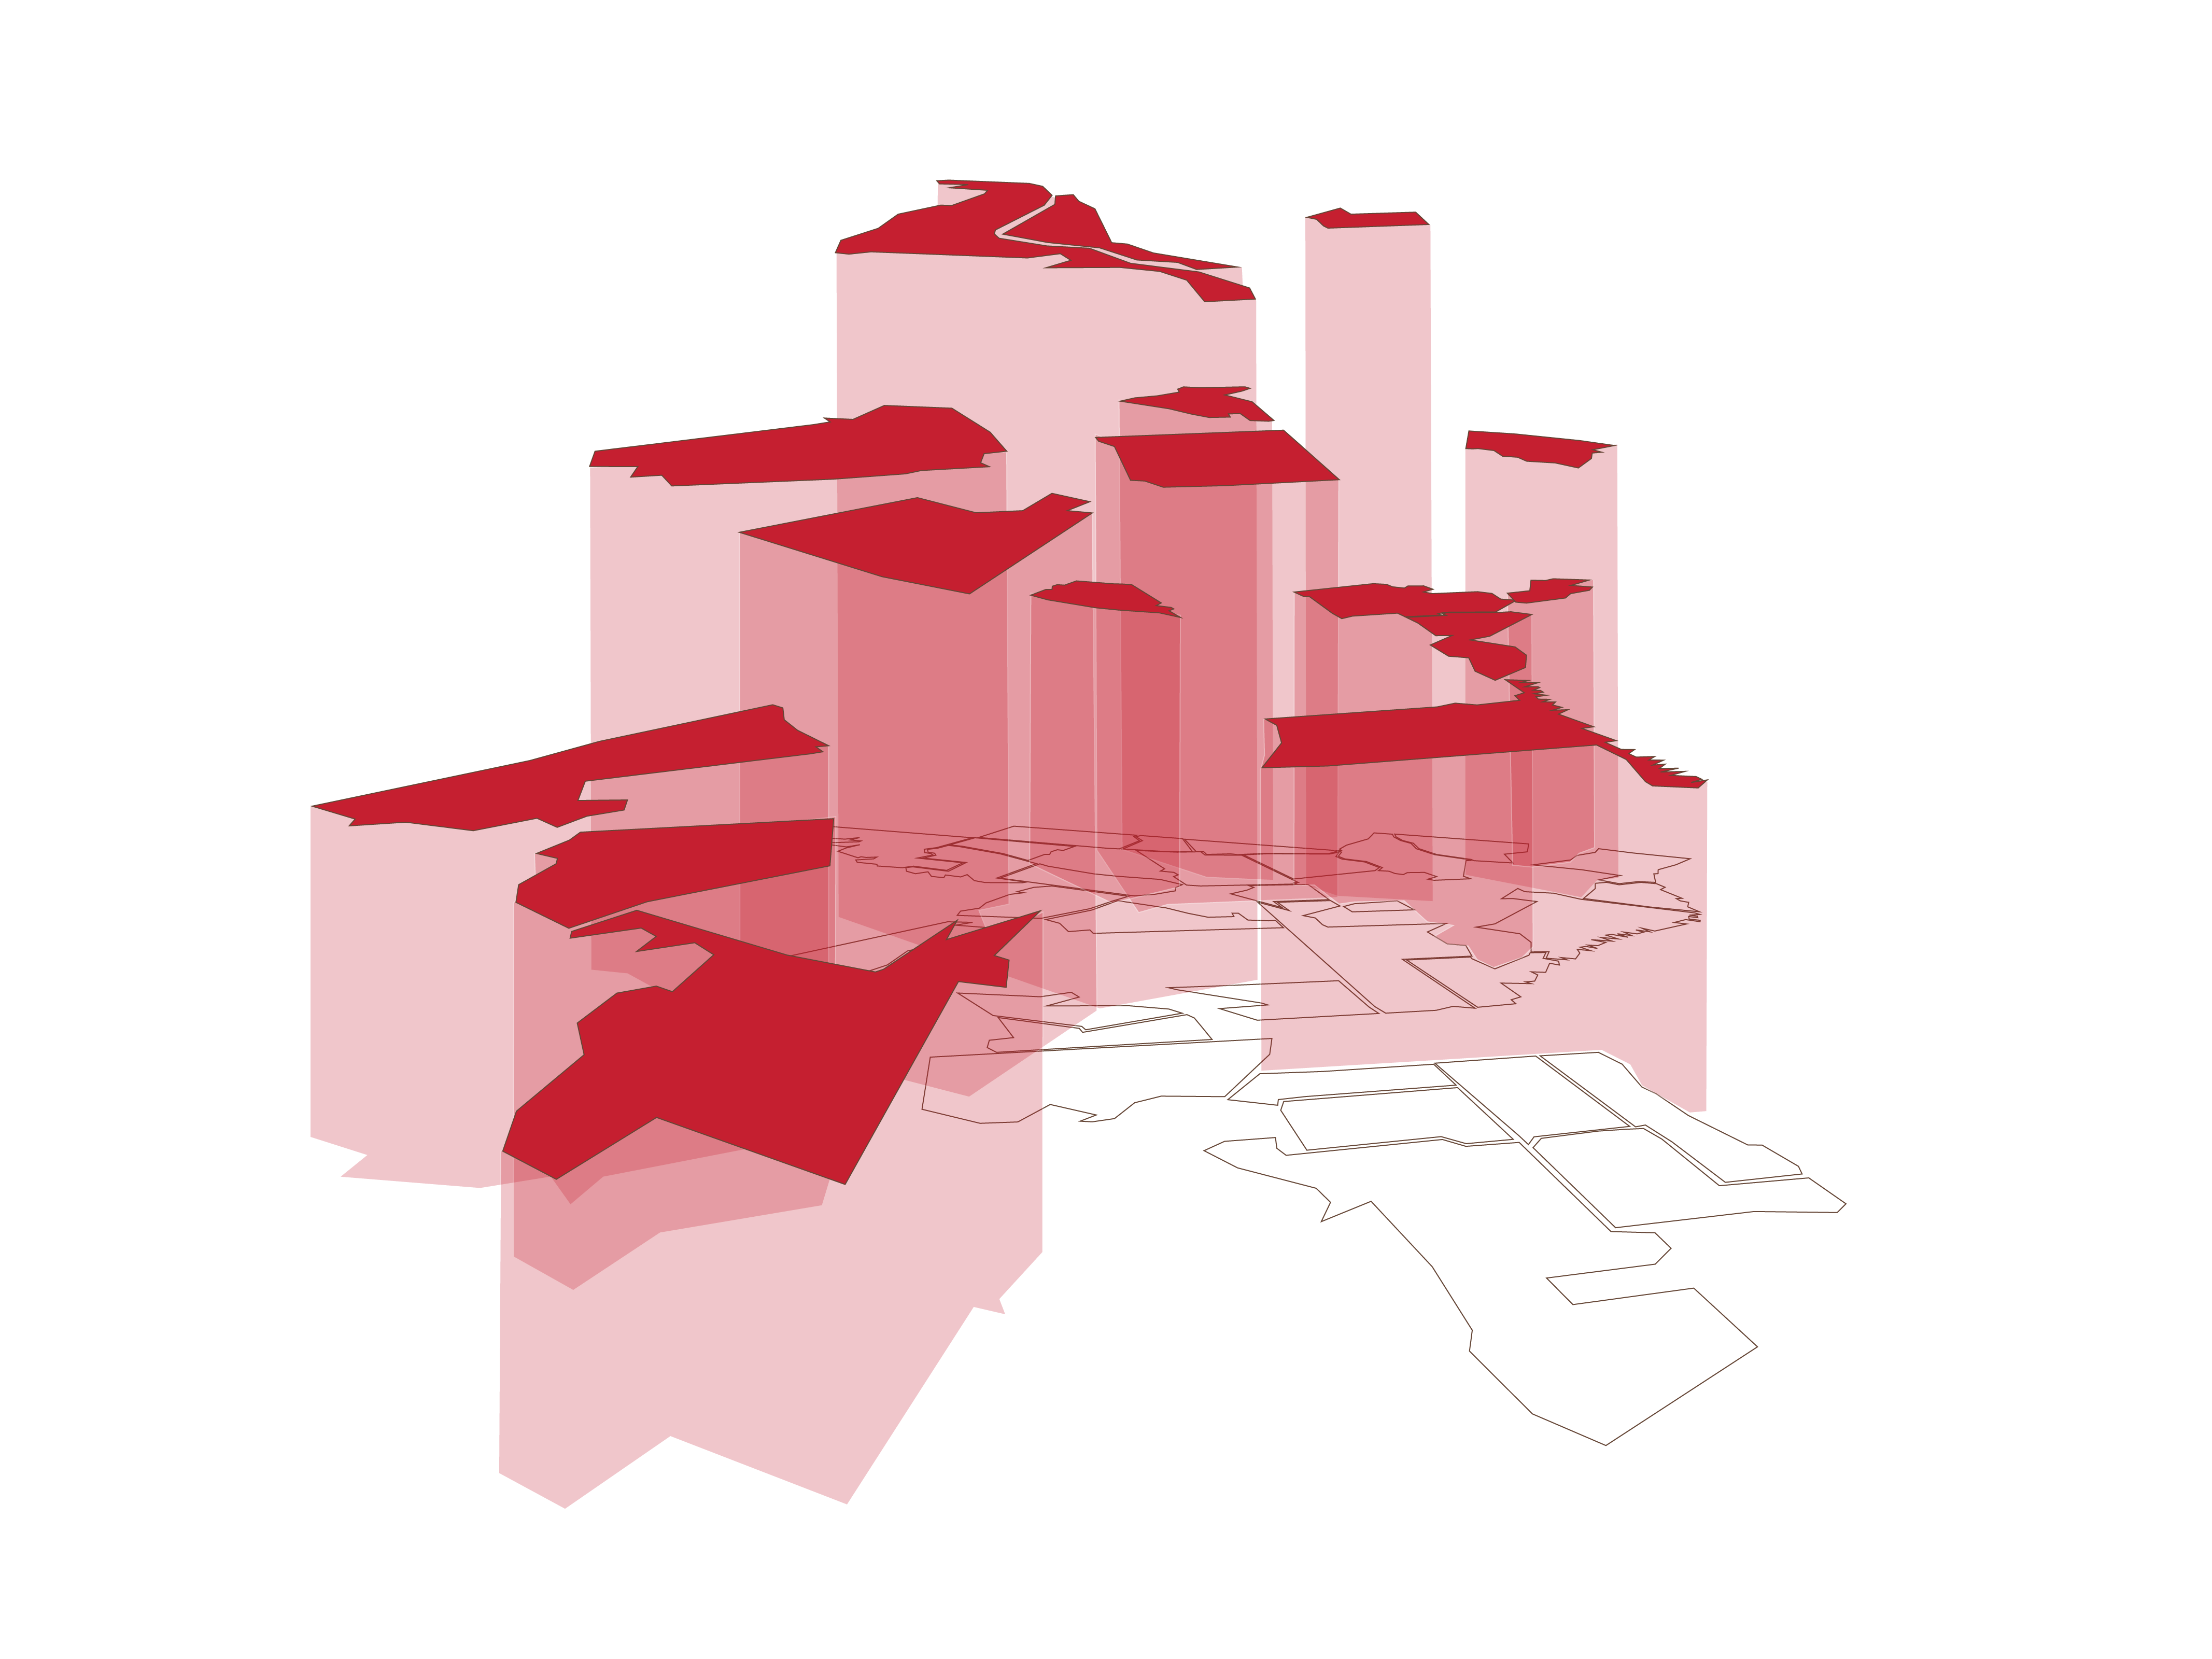
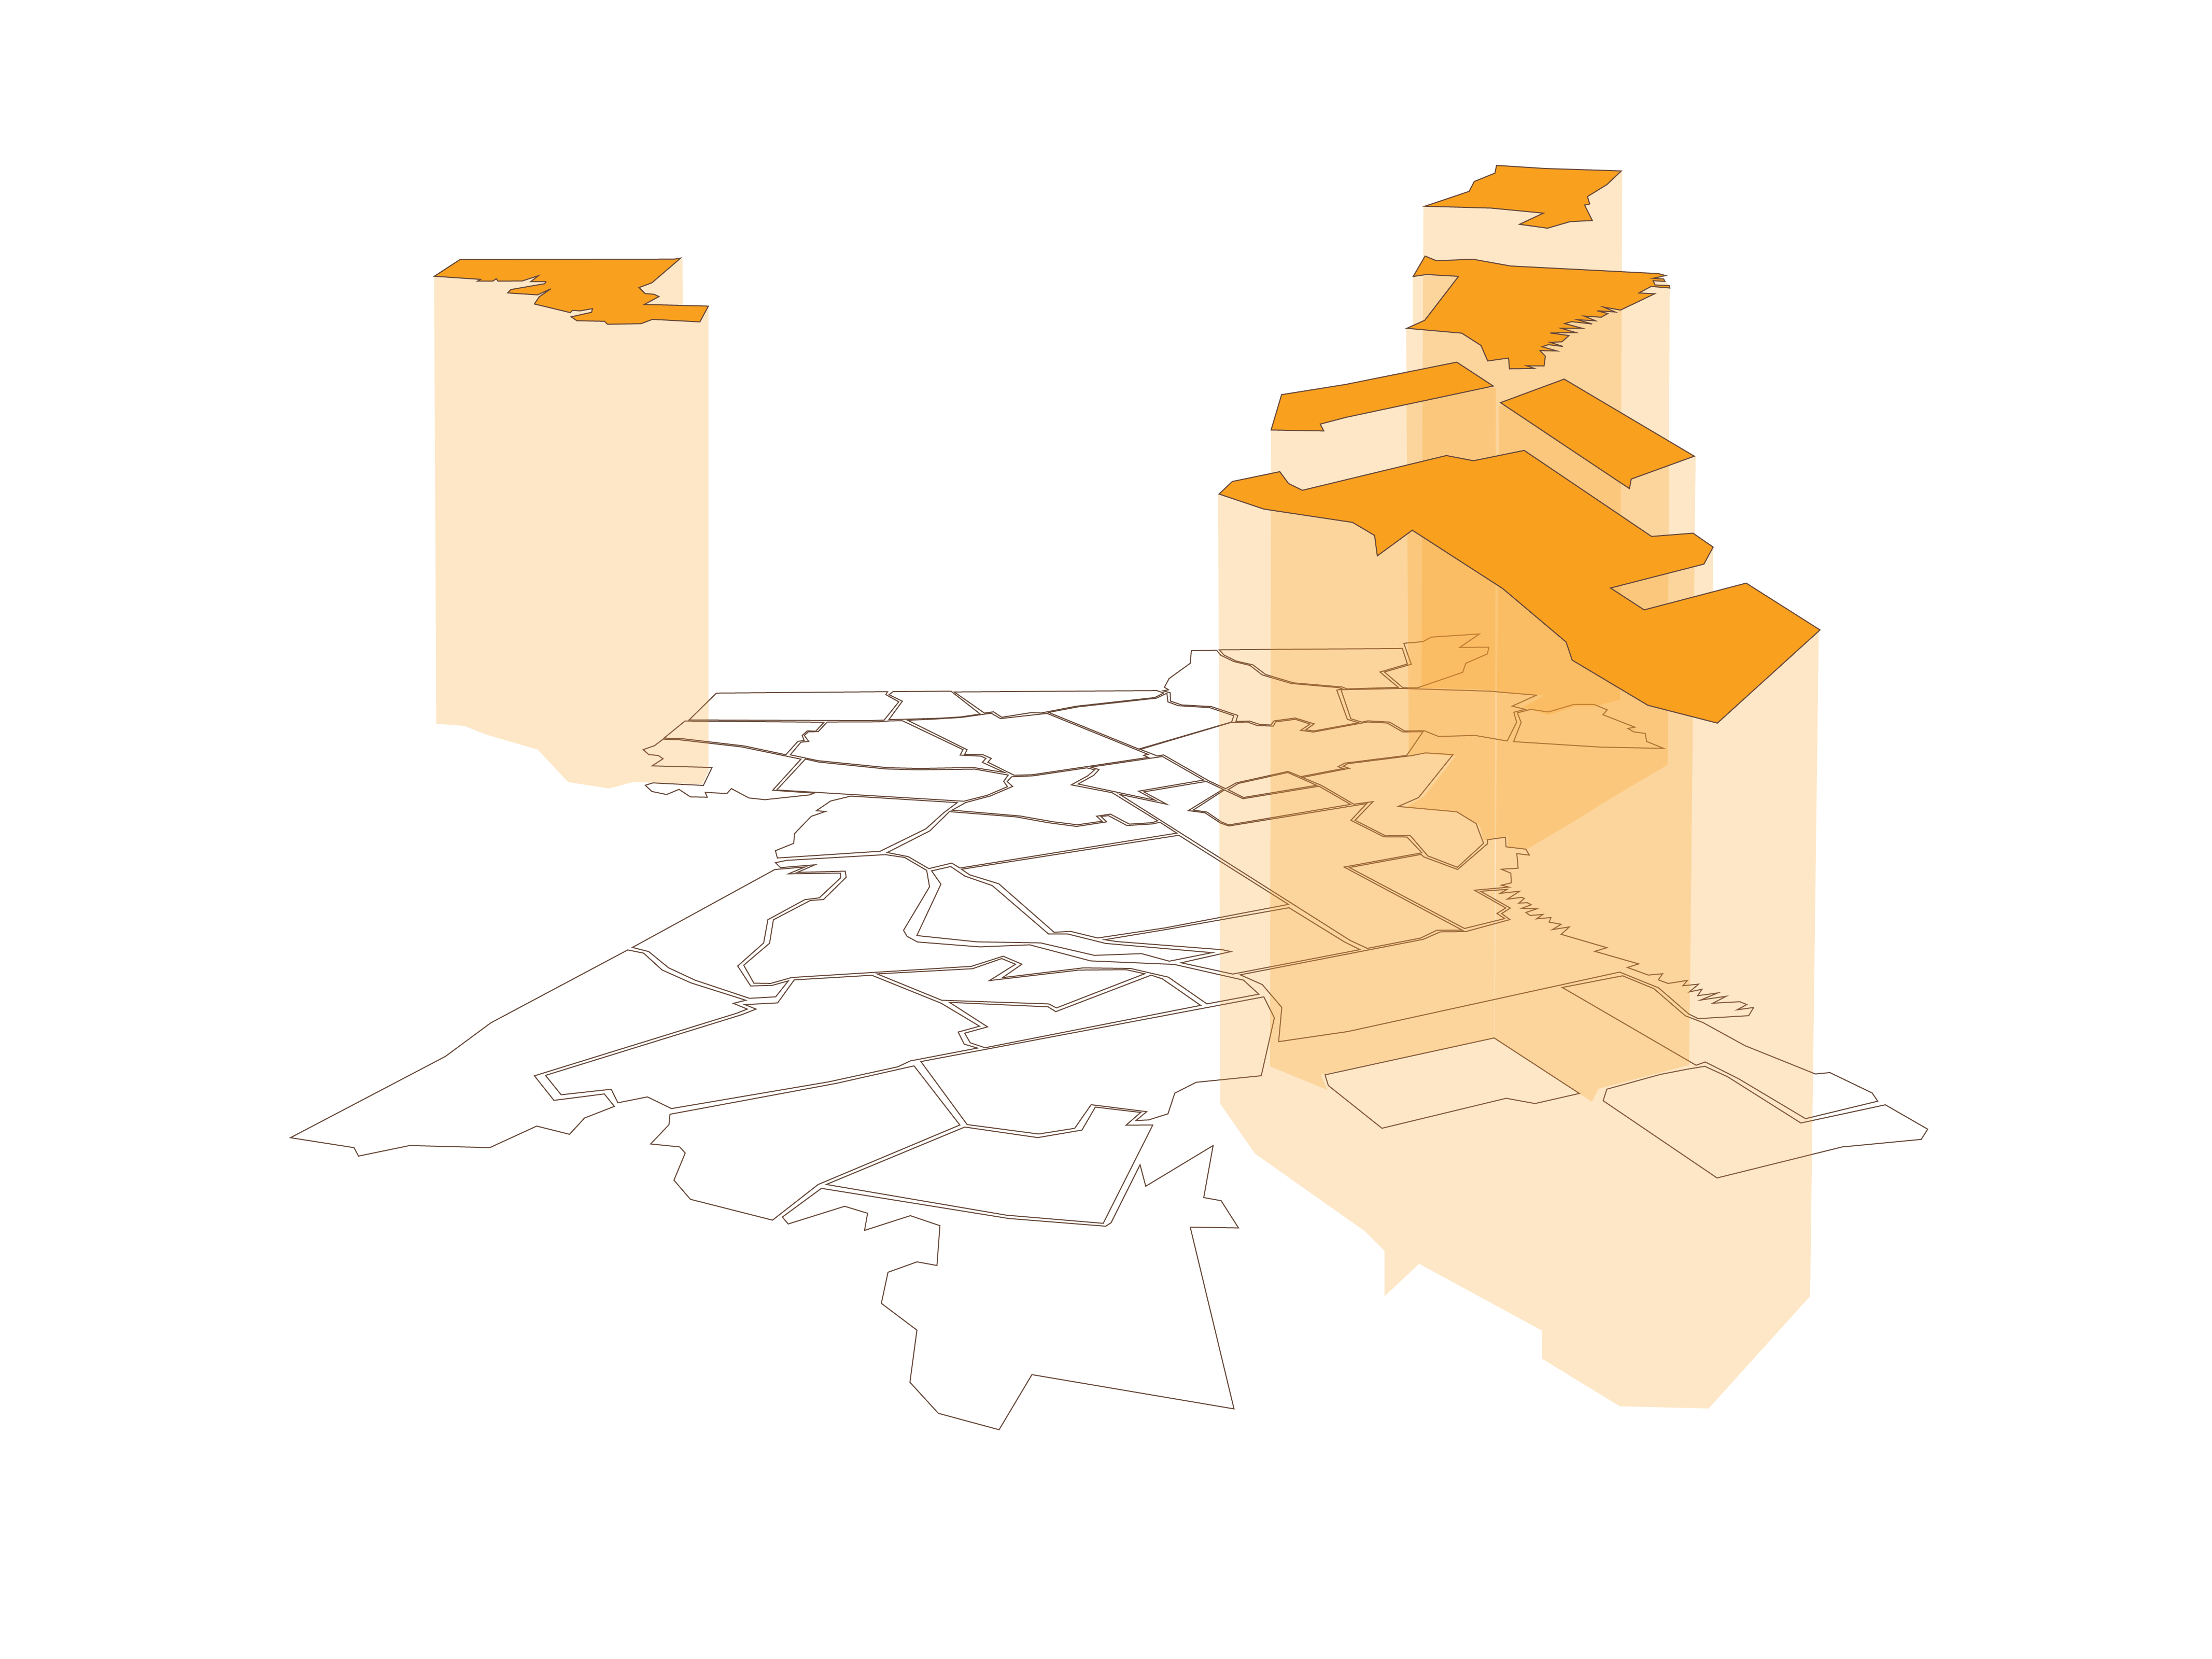
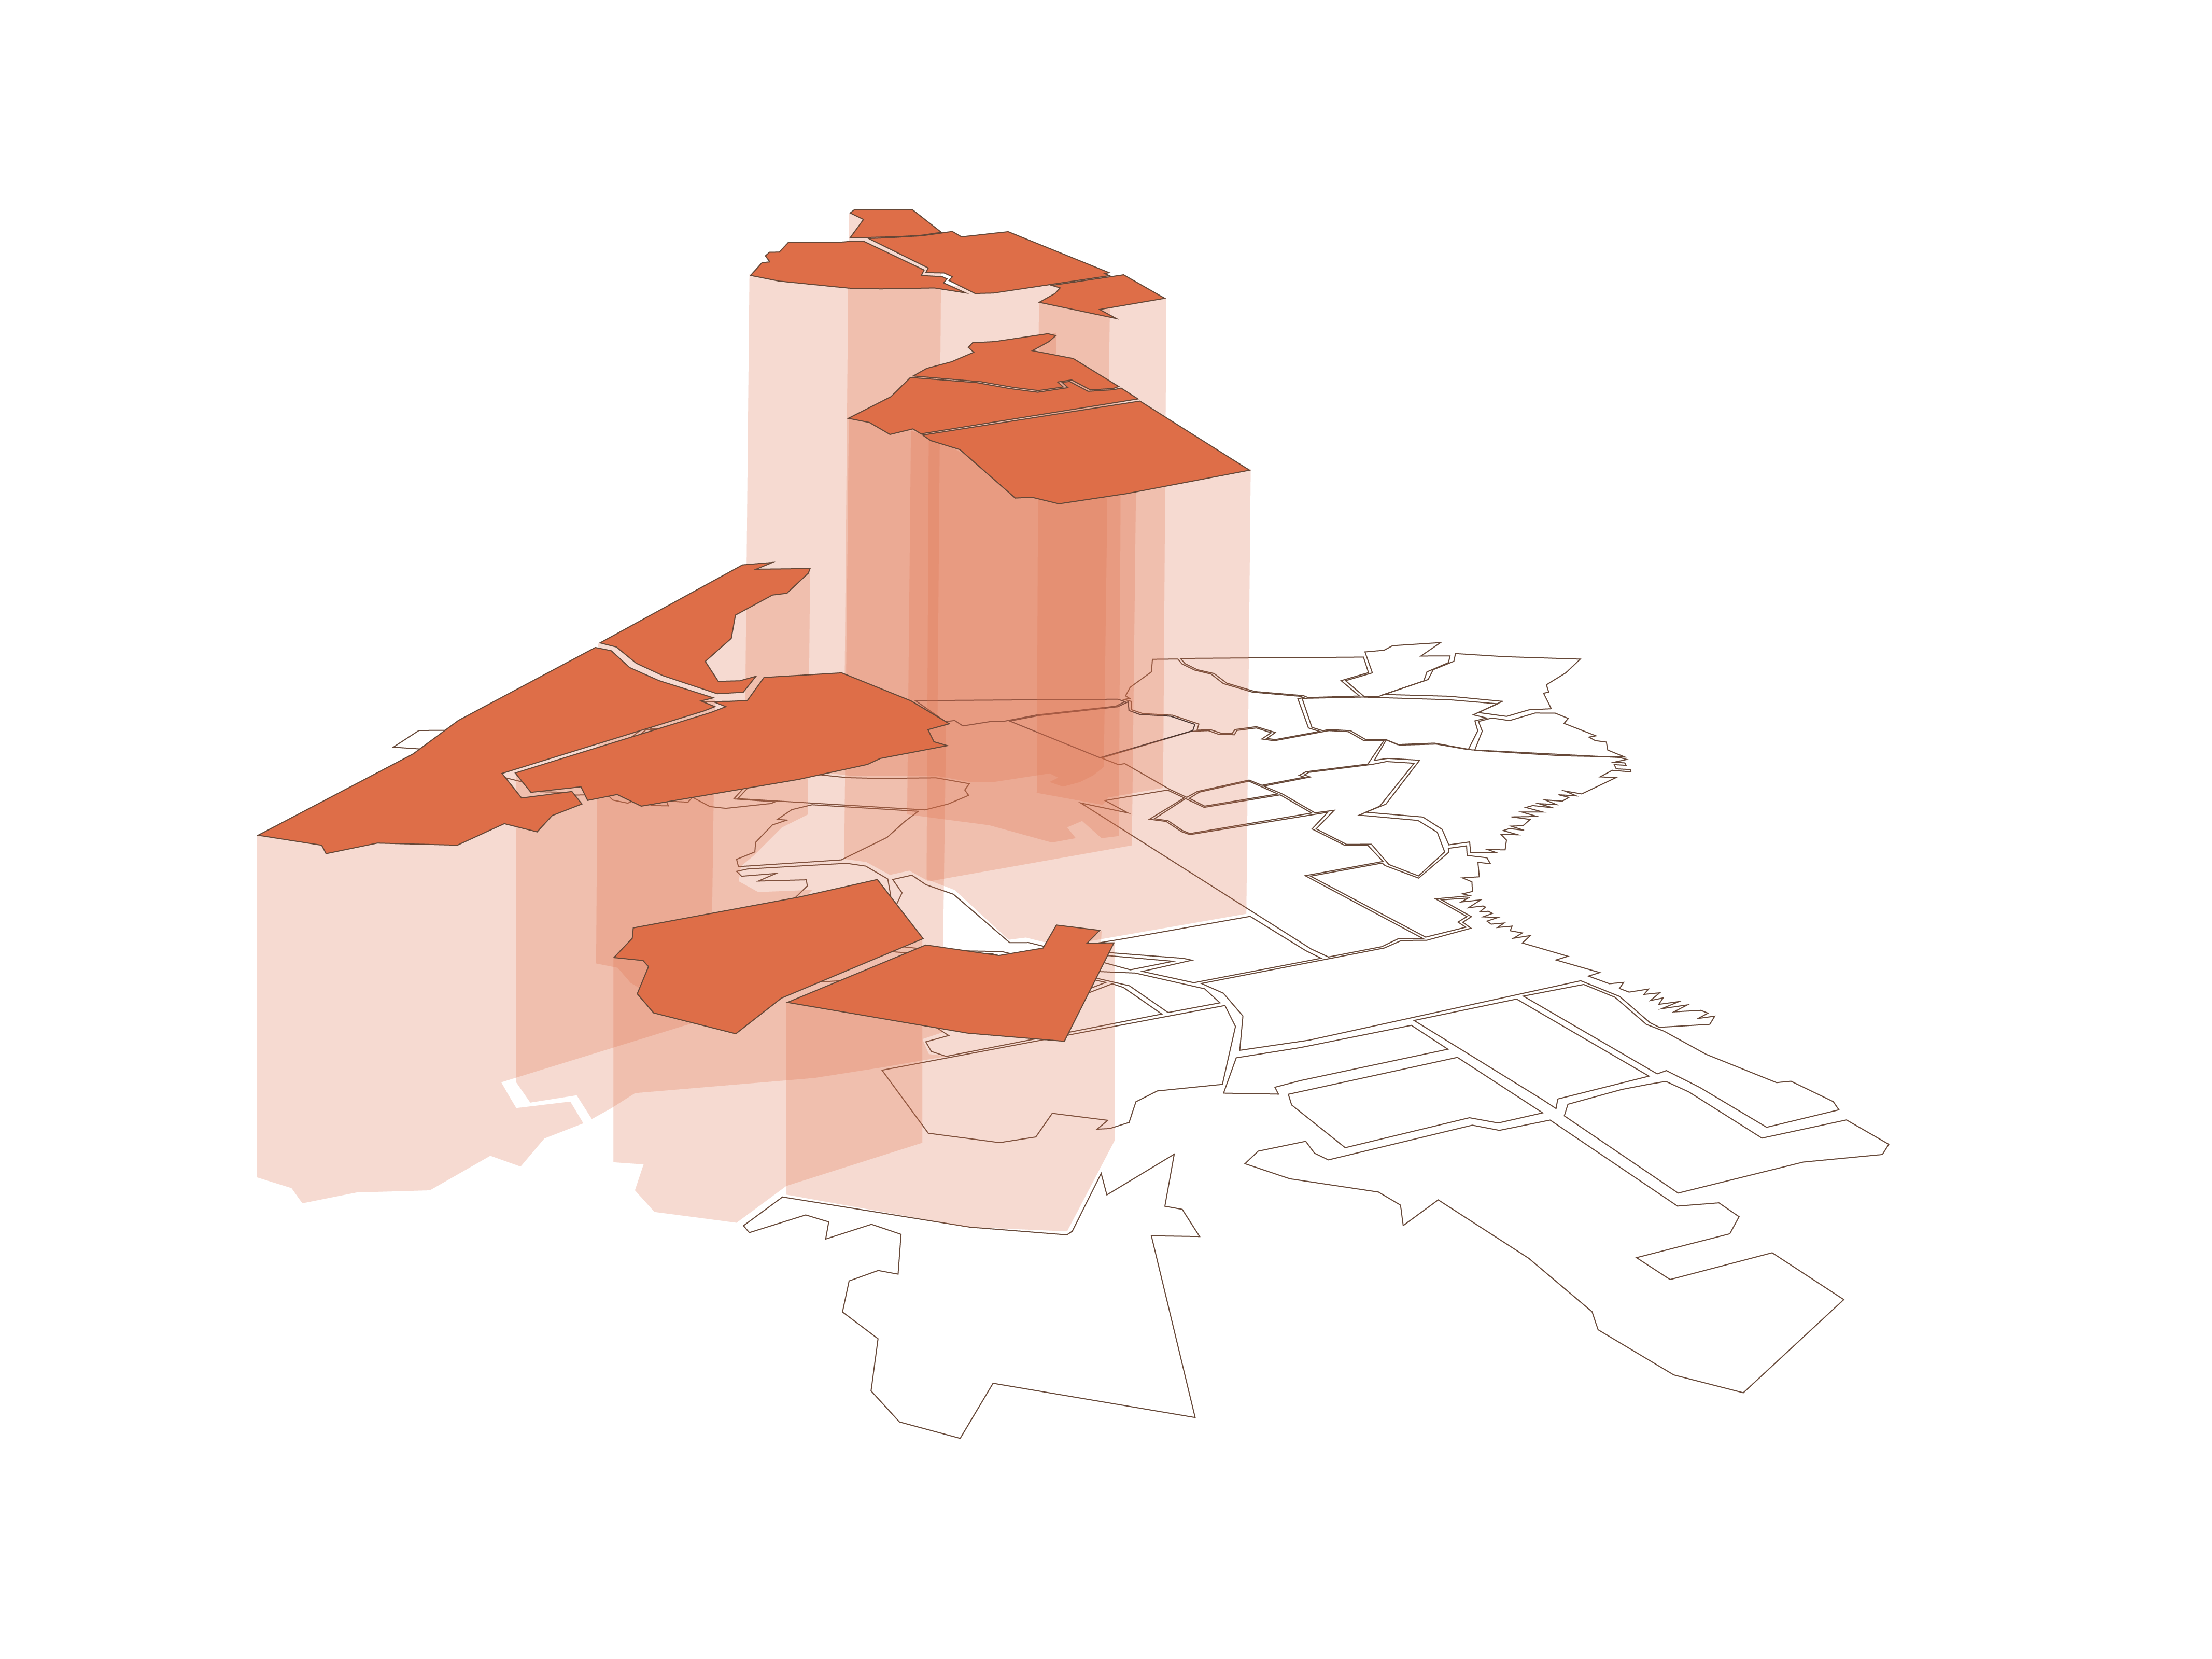
African-American Population Segregated
by Malaika Mebane
Philadelphia’s African-American population is the second-largest within the region. Its most densely populated areas are confined to clusters spread out mostly in the northwestern, southwestern, and northeastern areas due to social, economic, and cultural traditions.
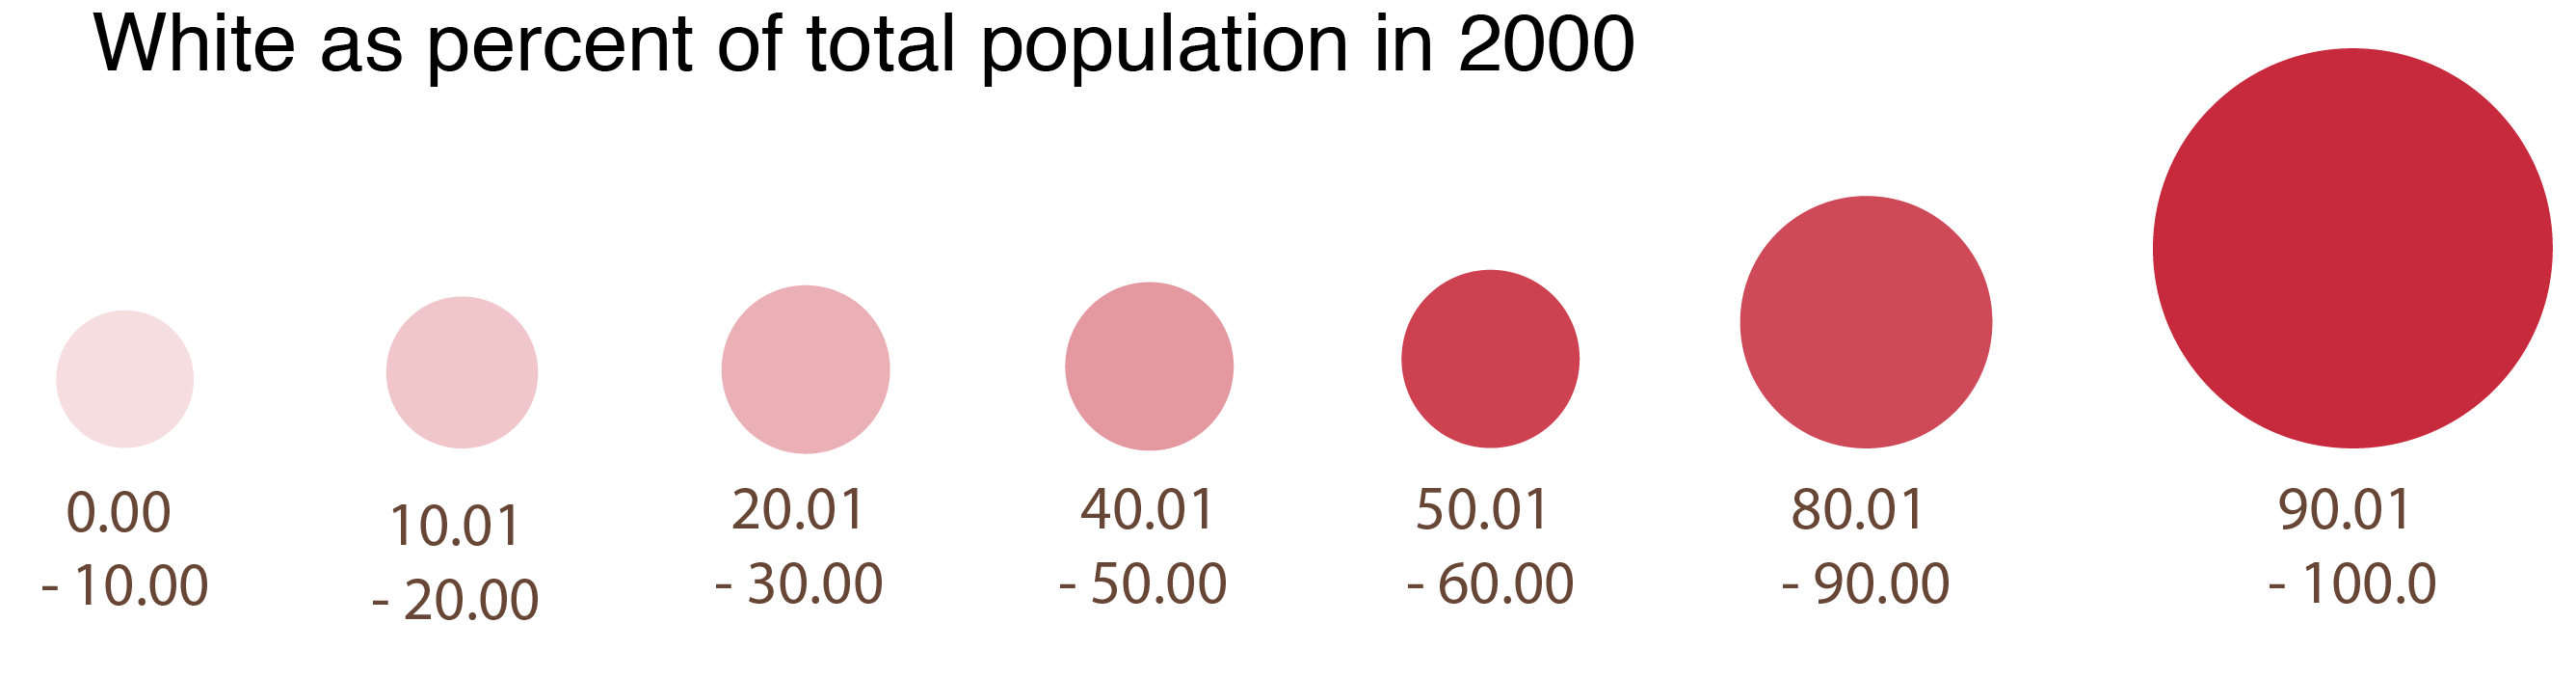
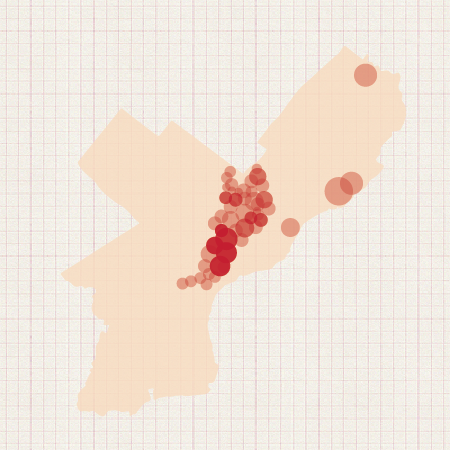
White Population Segregated
Philadelphia’s White population is the most dense, vast, and widespread within the region due to access and control of the religious, economic, and political powers that run the city.
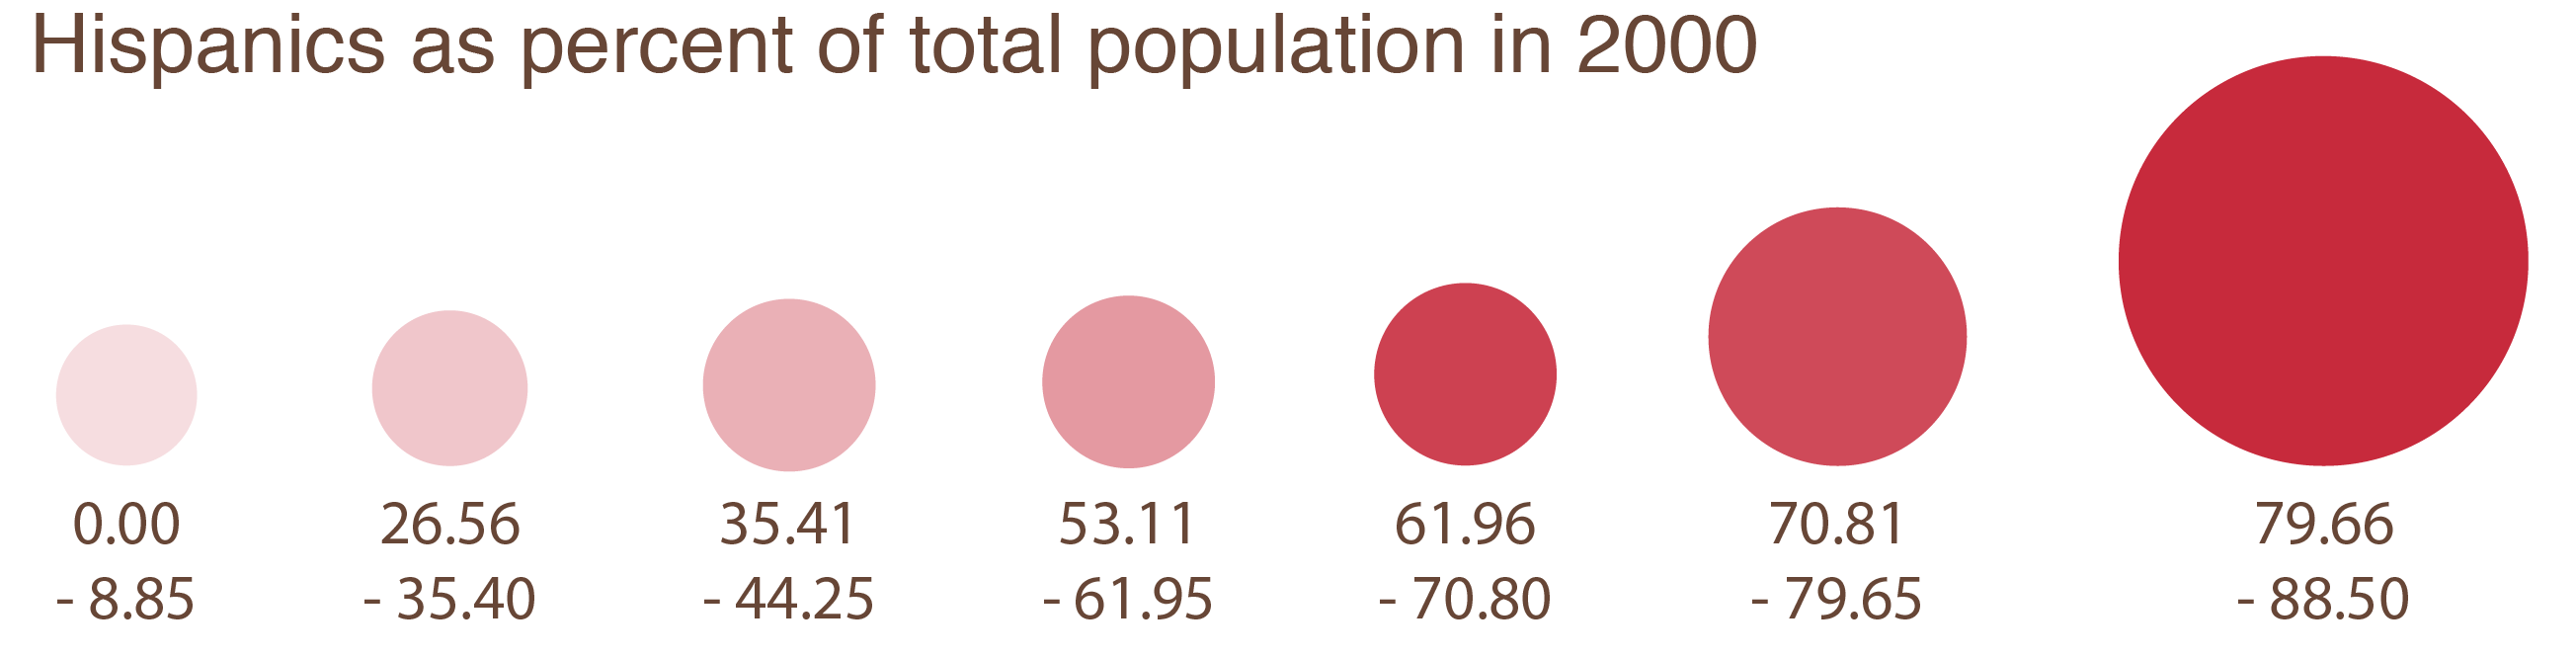
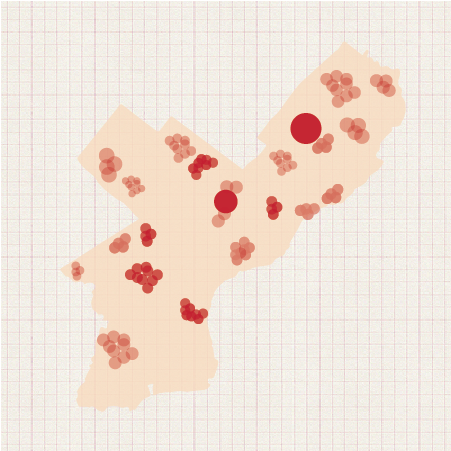
Hispanic Population Segregated
Philadelphia’s Hispanic population is mostly located in the central and northeastern areas of the city mainly due to cultural, social and economic issues, and demographics.
Asian Population Segregated
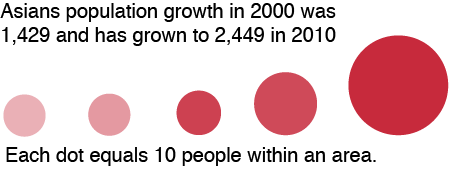
Philadelphia’s Asian population is the smallest, scattered into small clusters within pockets of the region. This is usually due to culture and tradition.
by Dan Cowden
1960s
Gay rights activists in Philadelphia, Washington, and New York collaborate to stage annual demonstrations for their civil rights outside of Independence Hall. In December 1962, Gaeton Fonzi publishes “The Furtive Fraternity” for the Greater Philadelphia Magazine. This is the first article published by a mainstream publication in the U.S. specifically on LGBT life, focusing on issues within the community rather than alienating its members.
1950s
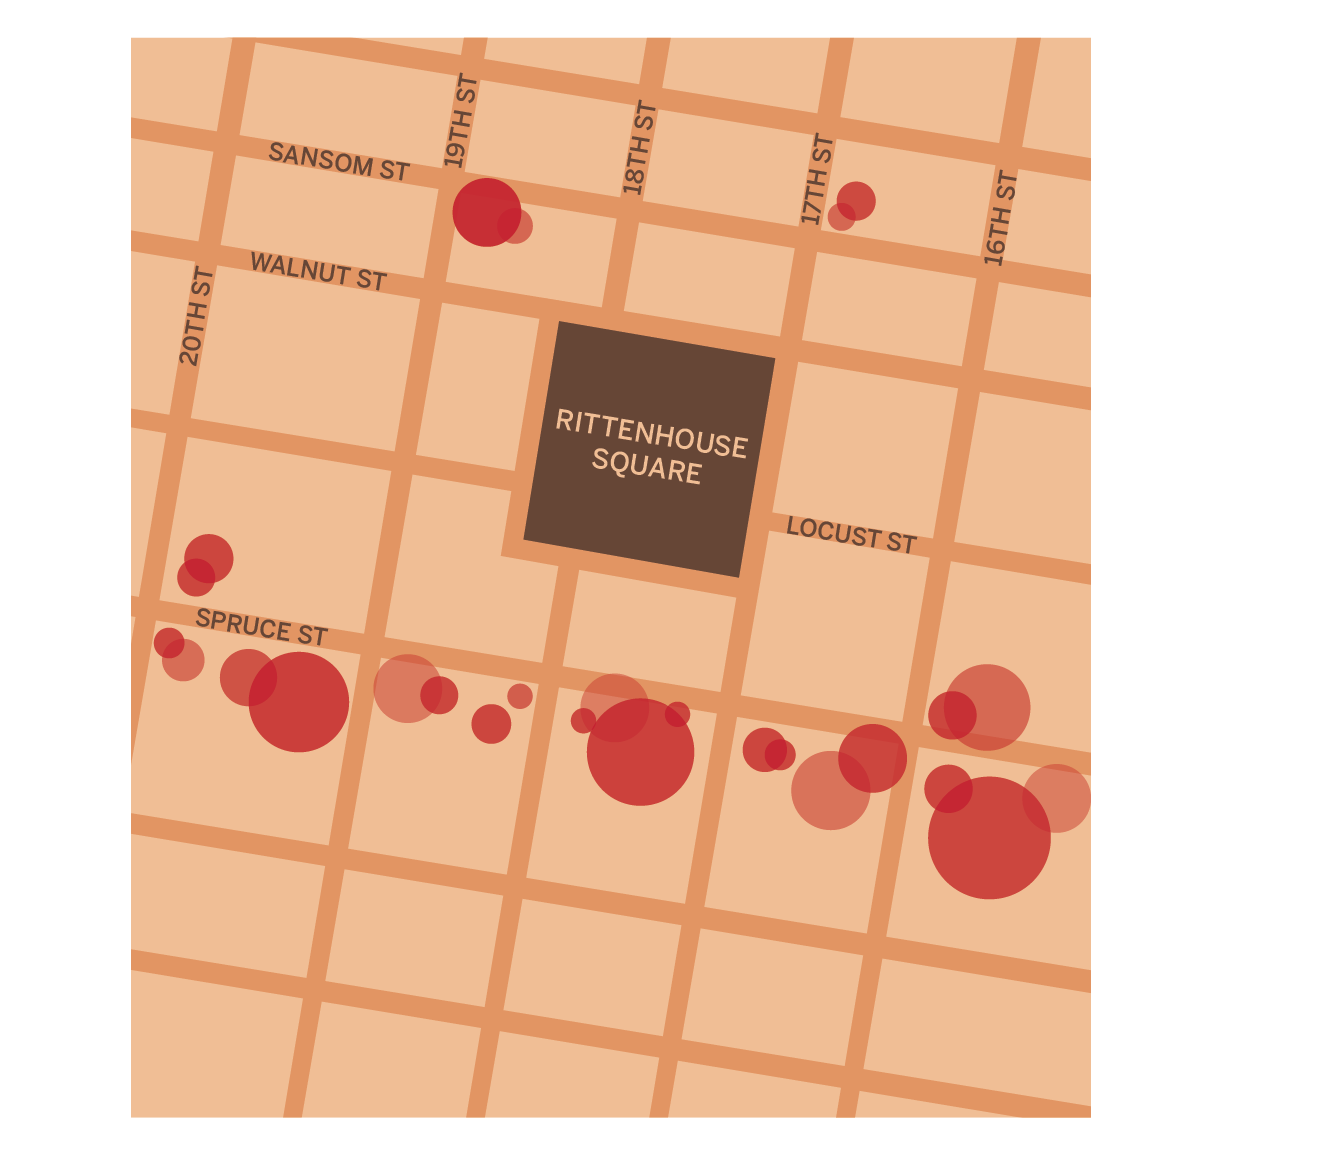
After World War II, a new influx of gay tenants moved into urban areas. Philadelphia was referred to as the “City of Homes” as housing units were on the rise. This was a push to create more homes to compete with the rising population in city centers. This “City of Homes” gave the growing gay population the safety and privacy that was necessary for them at the time. Certain places such as Rittenhouse Square and coffee shops along Samson Street became integral parts of the city’s gay geography.Spruce Street becomes a very popular road for gay men living in the city. They soon became known as “The Spruce Street Boys.”
Gay Men in Rittenhouse Square, 1953
Members of the LGBT community protest for equal rights outside Independence Hall
1970s
The City of Philadelphia held its first Gay Pride March in June of 1972. Participants met in Rittenhouse Square and marched to Independence National Historical Park, where they held a rally with live music and speeches. This was a direct response to the Stonewall Riots of 1969 in New York City. From these events, powerful historical groups rose, such as the Gay Liberation Front, the Gay Activist Alliance, and Dyketactics. As the need for safe recreational spots grew in the LGBT community, Philadelphia saw its first gay community center open on South Street in 1976.
Philadelphia’s first gay pride march, 1972
1980s
AIDS became a global crisis in the 1980s, and it disproportionately affected the residents of the gay community. In Philadelphia, groups such as ActionAIDS, Unity, Manna, ACT-UP, and the AIDS Law Project of Pennsylvania formed to spread awareness and offer help to combat AIDS. Groups like these became a necessity because of a lack of government assistance. When the worst parts of Locust Street were razed and rebuilt, and crime continued as a major problem (particularly against transgender residents) the community and local associations formed a neighborhood watch to patrol the area. In 1982 the Gay Rights Bill, which had been stalled every year through the 1970’s, finally passed with little opposition. The Gayborhood did not earn its name until Outfest of 1995. There, David Warner jovally paraphrased a popular song from Mister Rogers’ television show, declaring, “It’s a beautiful day in the Gayborhood!”
Skiba, Bob. “Gayborhood.” Encyclopedia of Greater Philadelphia, philadelphiaencyclopedia.org/archive/gayborhood/.
Skiba, Bob. “The Roots Of The Gayborhood, The Eve Of A Milestone.” Hidden City Philadelphia RSS, hiddencityphila.org/2014/02/the-roots-of-the-gayborhood-the-eve-of-a-milestone/.
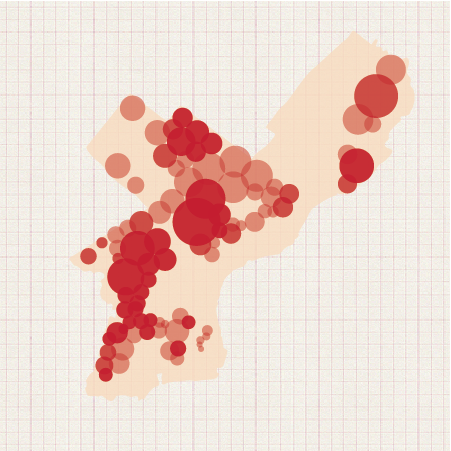
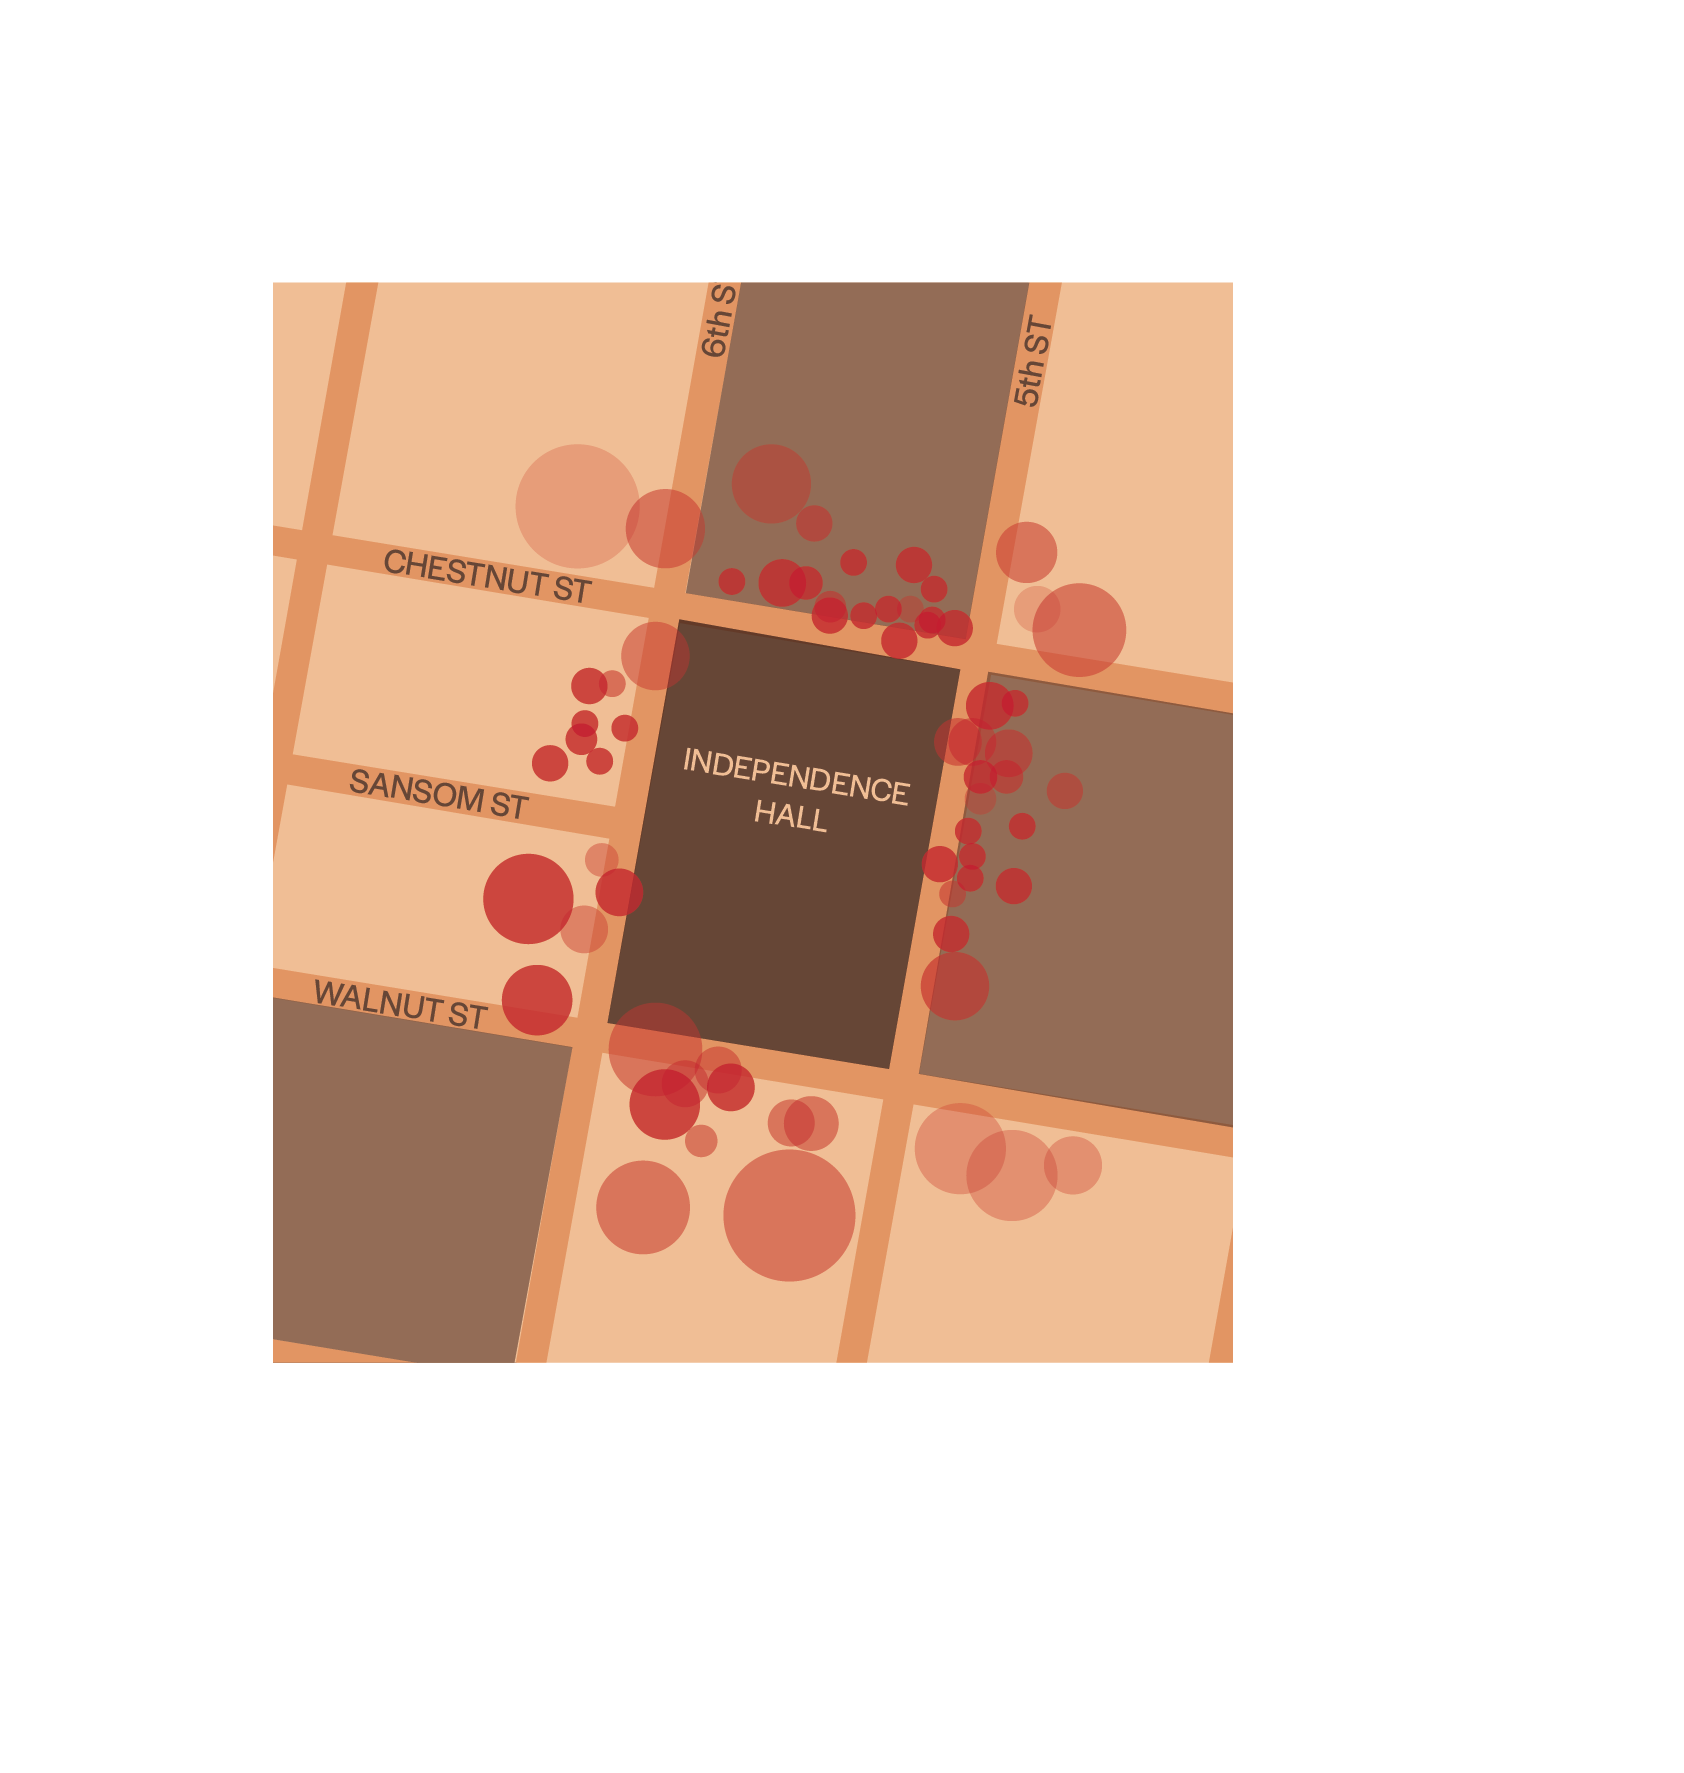
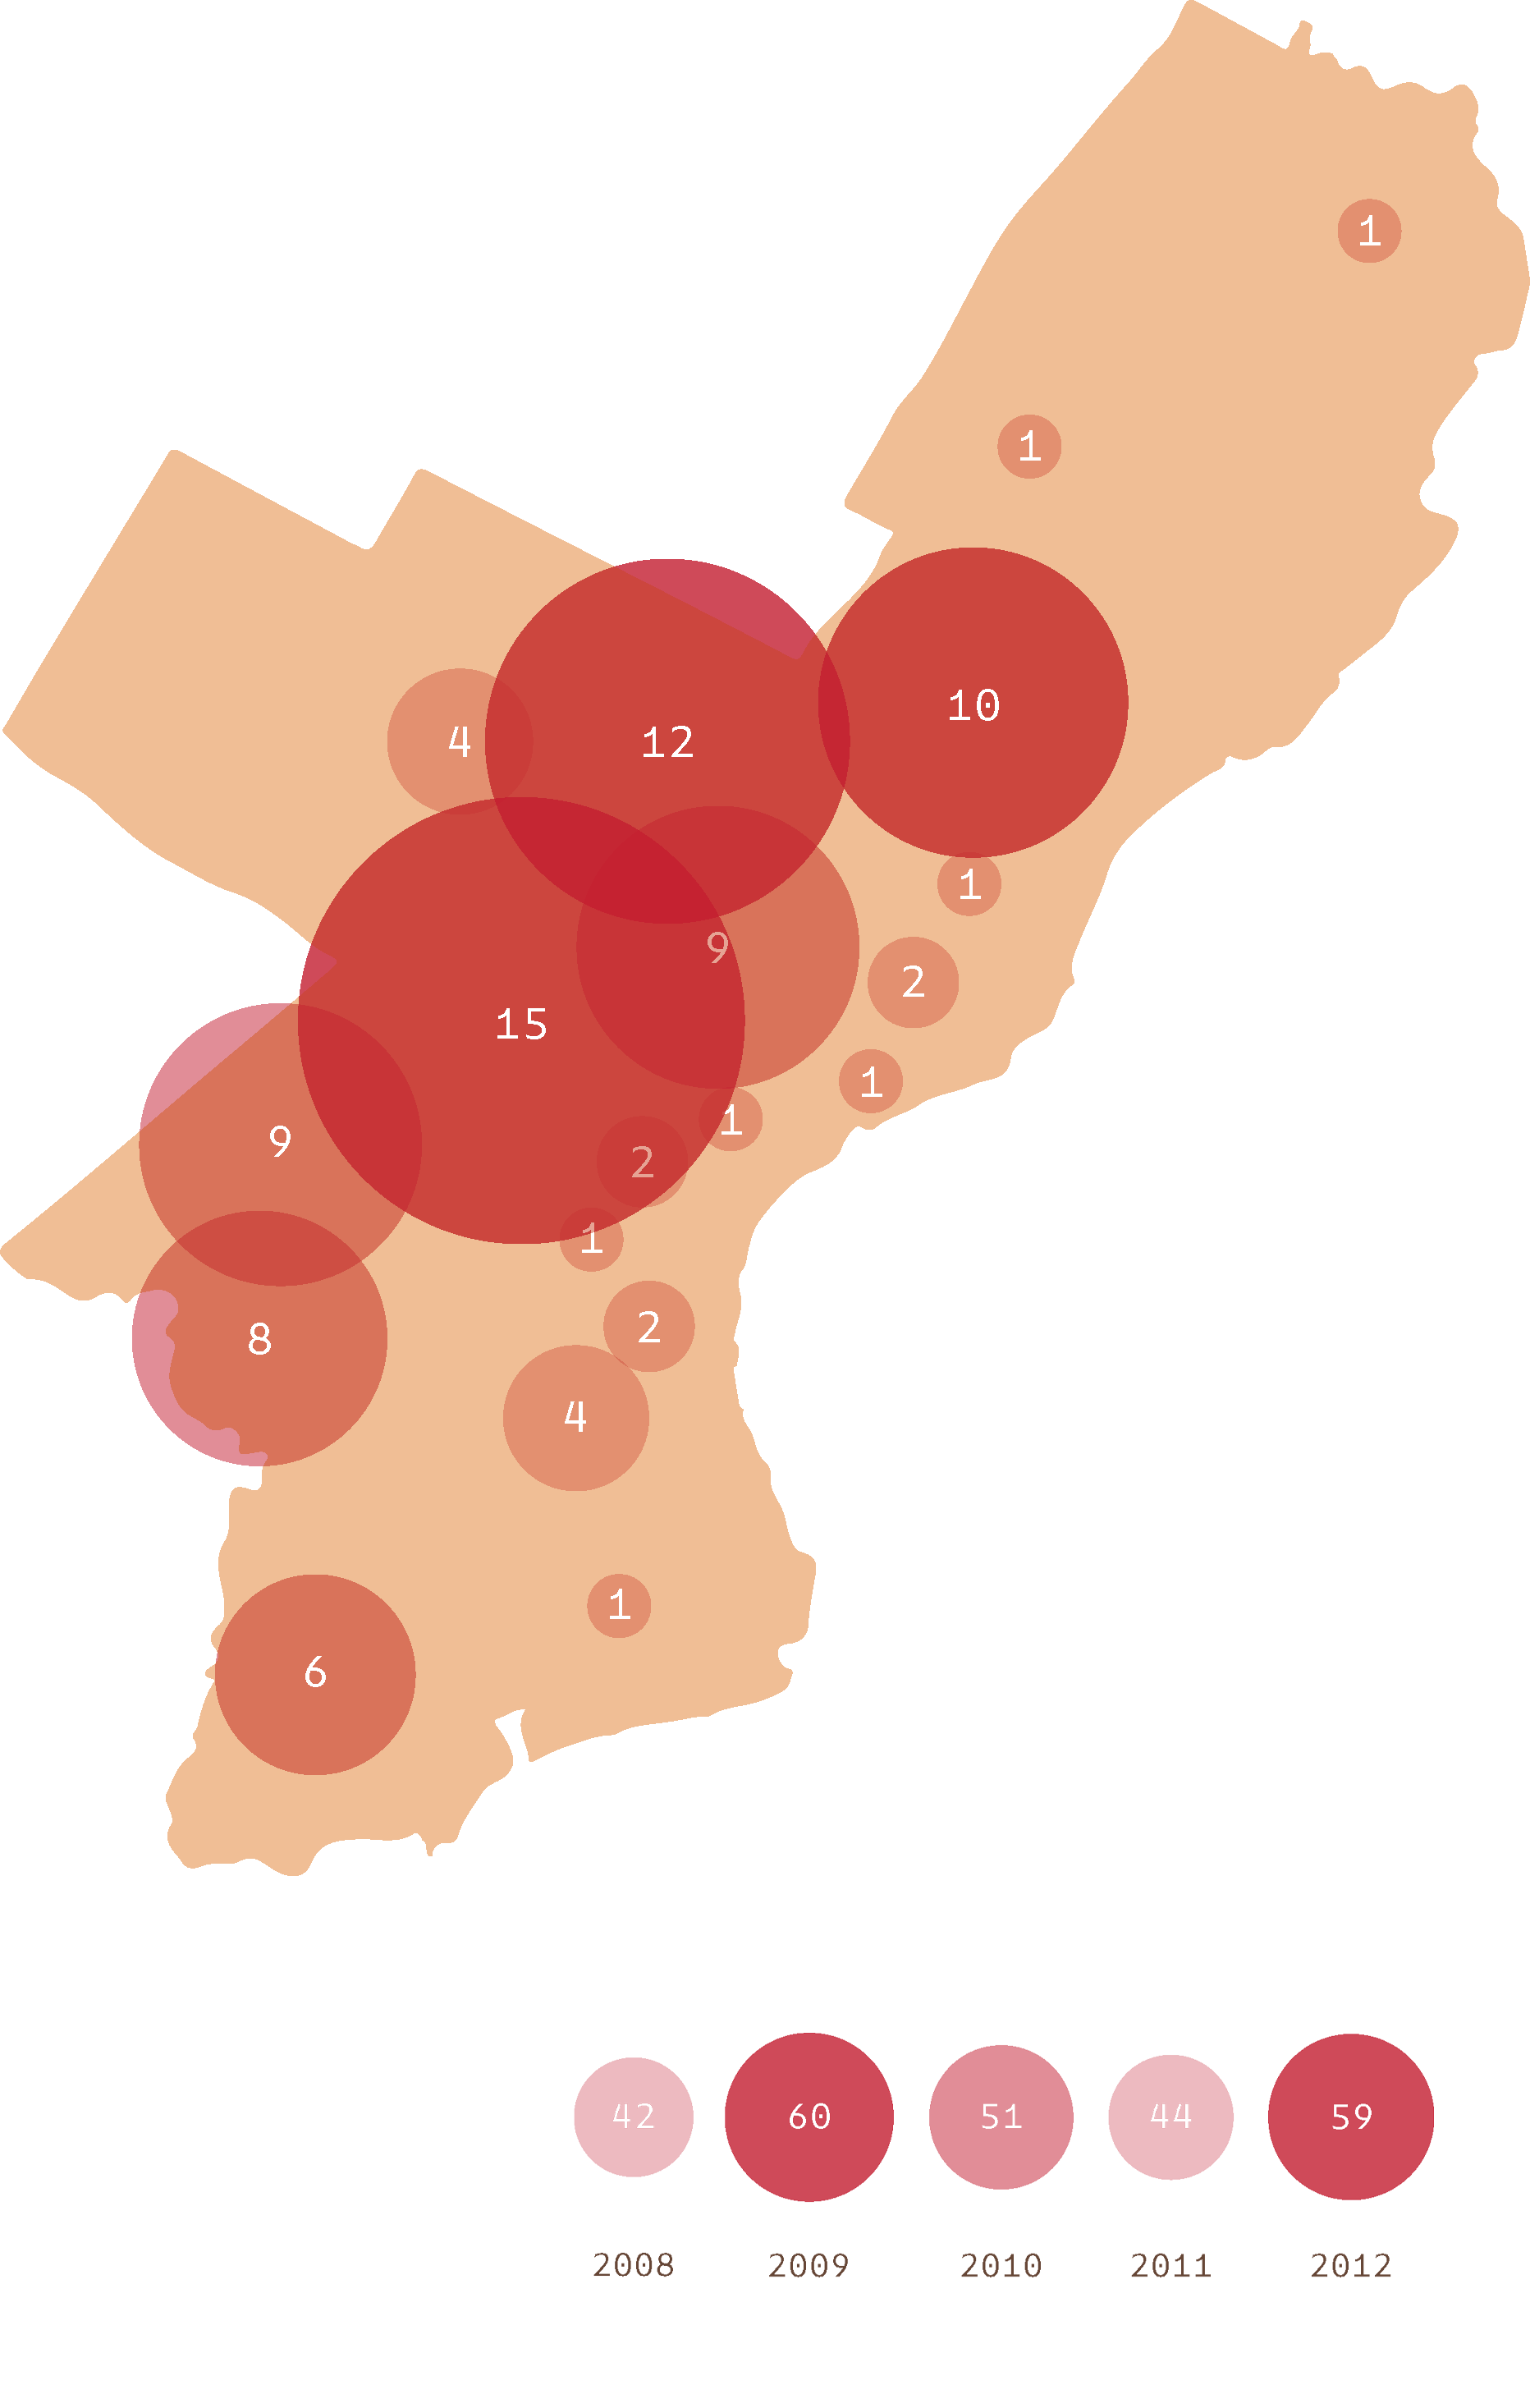
Police Involved Shootings
by Viktor Freeling
Injuries and Deaths in Philadelphia
(2013 – 2018)
This map diagrams every instance where a police officer’s bullet intentionally struck a suspect in the county of Philadelphia, by zip code. There are 101 instances of confirmed hits, and 144 overall instances of Police Involved Shootings (PIS) between 2013 and 2018. In 15 cases of PIS between 2013 and 2018, officers have been found in violation by the Use of Force Review Board, and 2 officers have been arrested by the District Attorney for their actions. Between 2013 and 2018, 36 suspects were murdered, 65 suspects were injured, and 43 suspects were not hit. In this same time, 19 officers were injured by suspects, and 1 officer was murdered. Of those 19 officers who were attacked, 9 were shot and shot back in response, 3 were hit by a moving vehicle and shot the suspect in response, 2 were in altercations without weapons. The 1 officer who was murdered was shot.
Below the map, are amounts of overall instances of PIS per year between 2008 and 2012. Since 2012, the overall rate of PIS has declined.
“Individual Shooting Summaries.” Officer Involved Shootings, Philadelphia Police Department, www.phillypolice.com/ois/.
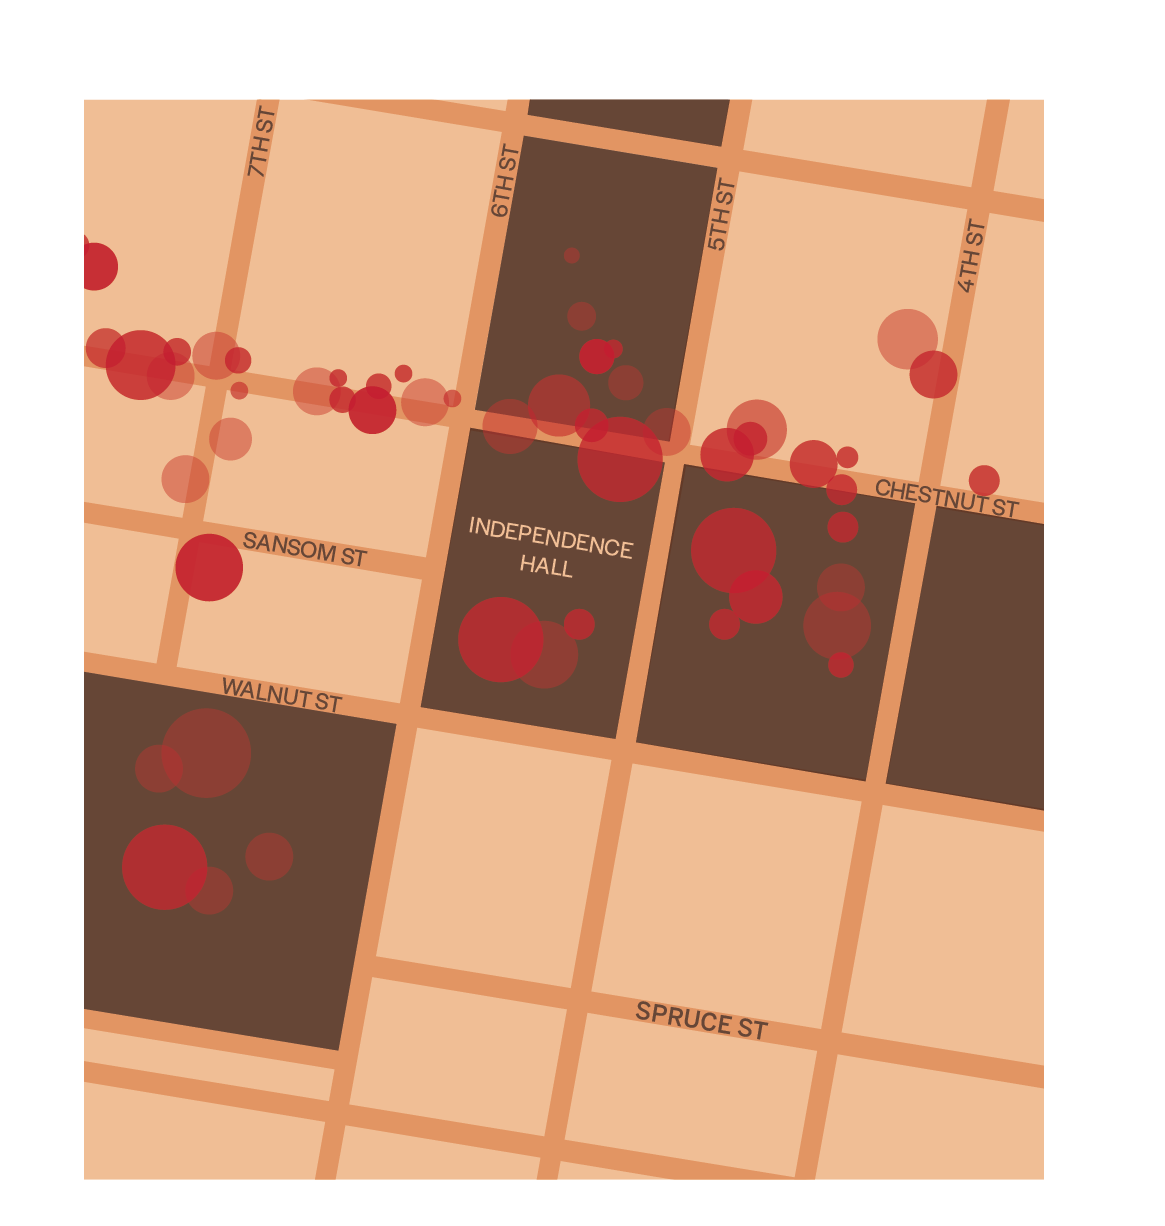
Crime Mapping & Ethnic Districts
by Jason Mitrione
Some areas in the City of Philadelphia have a reputation for high crime rates. Often people say, “Don’t go there at night,” and even raise the suspicion that specific racial groups are responsible. Criminal acts including violence, drug, and property crimes happen on a daily basis and not all incidents are reported on the local news. These maps show where the majority of crimes occur, as well as the districts where non-white racial groups make up the majority of the population.
Districts with the highest rates of reported crime in the last 30 days (DATA LAST UPDATED MAR 22, 2019 6:00 AM)
| Violence | Property | Drugs | |
| Parkland | 2 | 15 | 2 |
| Fairhill | 29 | 39 | 118 |
| Huntington Park | 22 | 45 | 10 |
| Frankford | 45 | 90 | 50 |
| West Philadelphia | 57 | 129 | 50 |
| Allegheny West | 25 | 66 | 20 |
| North Philadelphia West | 73 | 235 | 20 |
| North Philadelphia East | 57 | 176 | 21 |
| Feltonville | 39 | 83 | 21 |
| East Germantown | 24 | 83 | 7 |
| Kensington | 56 | 129 | 177 |
| Tioga/Nicetown | 21 | 63 | 32 |
| Center City | 50 | 416 | 28 |
| Port Richmond | 19 | 82 | 17 |
Districts where specific racial groups represent 80% or more of the population (DATA LAST UPDATED SEPTEMBER, 2018)
White Dominated Neighborhoods
African-American Dominated Neighborhoods
Hispanic Dominated Neighborhoods
http://data.philly.com/philly/crime/
Hate Crime and Extremism
From Extremist Violence to Police Neglect
by Angel Jefferson
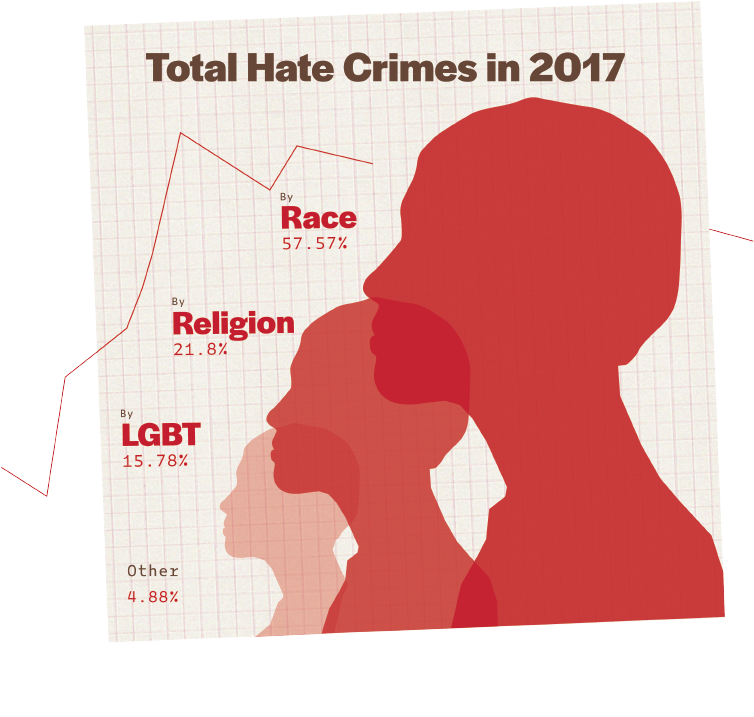
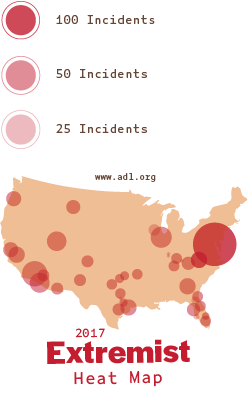
Did you know?
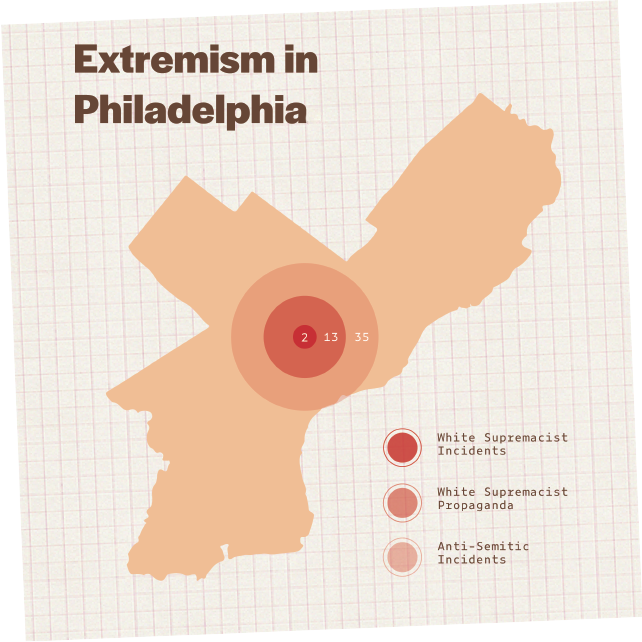
There are currently 36 active hate groups in the state of Pennsylvania, including Neo-Nazis, White Supremacists, Klu Klux Klan divisions, and more.
The aftermath of the 2016 national presidential election of Donald Trump lead to an exponential growth in hate crime and extremist activity. From the time of his election to the end of 2017, the incidence of almost every type of hate crime has risen. With a white nationalist and xenophobic president in power, hateful and extremist Americans have found themselves less afraid to act out in hate and prejudiced violence.
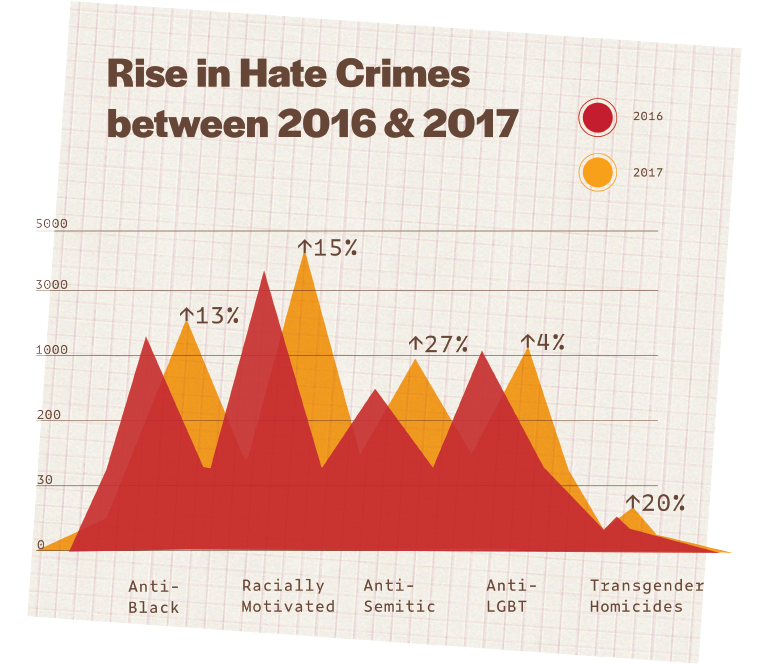
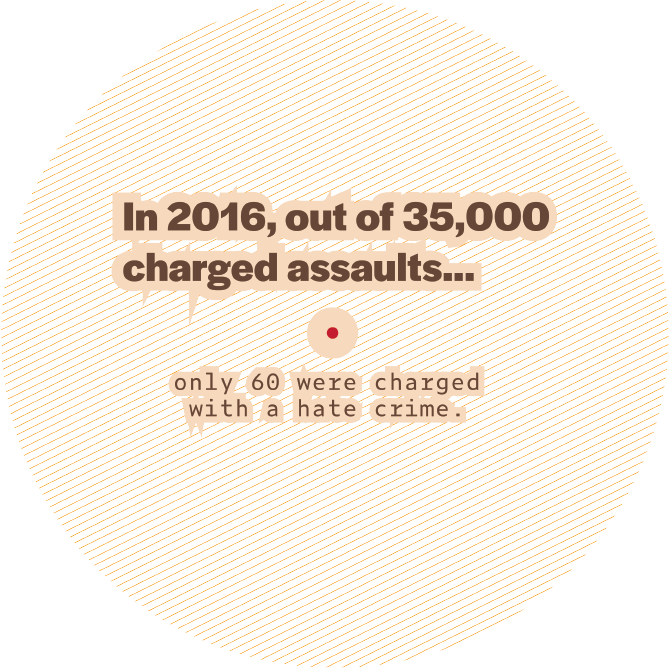
According to the Department of Justice, about 54% of hate crimes in the United States go unreported. In the City of Philadelphia, 7 hate crimes were reported in 2016, while in 2017 there were 19. That is a more than 50% increase in one year’s time. As a city with a population of 1.5 million, it is hard to believe that only 19 hate crimes across the city occured in a length of one year. The police reports show a severe lack of transparency and accuracy. As a matter of fact, there isn’t a single public record or data sheet of hate crimes in Philadelphia.
Police departments are notorious for hiring abusers and people belonging to a variety of hate groups, meaning that police departments are not a credible source of information for correct facts about hate crimes. The Philadelphia Police Department repeatedly and unconstitutionally commits unjust biased acts of hate. The legal case Bailey vs. City of Philadelphia cited that the PPD unlawfully stopped over 6,000 people, 80% of whom were non-white citizens. It is clear that the Philadelphia Police Department hosts a serious problem with dismissing hate crime charges, as well as creating and releasing public records of occuring hate crimes.
Between 2017 and 2018 there have been 49 incidents in Philadelphia that involve extremist activity. The primarily active hate groups in Philadelphia are white nationalists and antisemitic individuals. Over the years, multiple white nationalist groups handed out recruitment flyers and sprayed graffiti of their insignias and hate speech. There have also been upwards of 35 documented antisemitic incidents within the city, including physical and verbal assaults, vandalism, and over a dozen confidential cases.
“ADL H.E.A.T. Map.” Anti-Defamation League, https://www.adl.org/education-and-resources/resource-knowledge-base/adl-heat-map.
Chen, Crystal. “Philadelphia Neighborhood Rent Map: Spring 2018.” The Zumper Blog, 21 May 2018, https://www.zumper.com/blog/2018/05/philadelphia-neighborhood-rent-map-spring-2018/
.Esposito, Nicolas. “Nicolas Esposito.” CleanPHL, Nicolas Esposito /Wp-Content/Uploads/2017/06/Logo-Clean-Phl-Hortz.png,
2 Apr. 2019, https://cleanphl.org/.
“Hate Crimes.” FBI, FBI, 3 May 2016, https://www.fbi.gov/investigate/civil-rights/hate-crimes.
“Hate Map.” Southern Poverty Law Center, 26 Sept. 2019, https://www.splcenter.org/hate-map?state=PA.
“Map: Philly's Most Underserved Neighborhoods for Public Transit.” PhillyVoice, 9 Feb. 2018, https://www.phillyvoice.com/map-phillys-most-underserved-neighborhoods-public-transit/.
“Mapping Inequality.” Digital Scholarship Lab, https://dsl.richmond.edu/panorama/redlining/.
“New Deal Era Map Shows Zones of Philly Segregation, Prosperity.” PhillyVoice, 25 Oct. 2016, https://www.phillyvoice.com/new-deal-era-map-shows-boundaries-philly-segregation/.
Philadelphia Neighborhoods, https://www.dvrpc.org/webmaps/pin/index.htm.
“The Storefront Index.” City Observatory, 2 June 2016, http://cityobservatory.org/the-storefront-index/.
“This Map Shows Everywhere in Pennsylvania You Can Buy Wine and Six-Packs to Go.” PhillyVoice, 11 May 2017, https://www.phillyvoice.com/this-map-shows-everywhere-in-pennsylvania-you-can-buy-wine-and-six-packs-to-go/.
Double Consciousness in Art Students
–––Gender–––Sexuality–––Nationality–––Ethnicity–––Social Status–––
by Davina Johnson
There are two types of double consciousness, internal and external. W.E.B. Du Bois’ defines internal double consciousness as an internal struggle of identities within a person, making it difficult in theory to make a decision to satisfy all parts of him-, her- or themselves. External double consciousness is that an individual acts depending on the perception of how those around them perceive them. A whole group of people are constantly trying to measure themselves through the eyes of others. There is a level of social acceptance for this perspective in turn of the century race relations, sociability, and even existence itself.
Minorities must be aware of how others view them
because these could potentially put them into compromising positions
The Angry Black Women
The Hoodie
Flamboyant
Hijab
DUBOIS, W. E. B. PHILADELPHIA NEGRO: a Social Study (Classic Reprint). FORGOTTEN Books, 2015.
Diversity and Segregation
in Philadelphia
by Wendell Hemingway